
Stock Of The Day: GameStop Stock Chart Illustrates Trading Lesson
Stock Of The Day: GameStop Stock Chart Illustrates Trading Lesson
On Wall Street, market gurus come and go. Every few years, there's a new "expert" who gains a following and can influence markets.
在華爾街上,市場大師們來來去去。每幾年就會湧現出一位新的“專家”,他會得到一批追隨者並能夠影響市場。
One thing that never changes is market principles. The GameStop Corp. (NYSE:GME) chart has a technical lesson, and that's why it's our Stock of the Day.
市場原則永遠不變。GameStop Corp. (NYSE:GME)的圖表具有技術教訓,這就是爲什麼它成爲我們的每日股票。
GameStop's $63 Resistance Level: Stocks tend to hit resistance and reverse when they reach price levels that were previously peaks or tops.
GameStop的63美元支撐位水平:股票往往會達到之前的峯值或頂部的價格水平時遇到阻力並逆轉。
There are traders and investors who buy at the very top. Many of them come to regret their decision when the price falls soon after. A number of these remorseful buyers decide they made a mistake and want to exit their positions.
有些交易商和投資者會在最高點買入。當價格在不久後下跌時,他們中的許多人會後悔自己的決定。其中一些後悔的買家決定他們犯了錯誤,並想要退出他們的持倉。
But they don't want to lose money.
但他們不想虧錢。
As a result, traders often decide to sell their shares if the stock ever rallies back up to their buying price. If there are enough of these remorseful buyers placing sell orders at the price level that had been a top or resistance before, it will form resistance at the level again.
因此,如果股票價格再次上漲到他們的買入價格水平,交易商通常決定賣出他們的股票。如果有足夠多的後悔的買家在這個價格水平上下賣單,並且這個價格水平之前曾是一個頂部或支撐位,那麼它將再次形成支撐位。
As you can see on the chart below, the $63 level has been important for GameStop. A peak formed on Nov. 2, 2021. After a selloff, the shares rallied and reached this level again Nov. 22, 2021.. Once again they reversed and headed lower.
正如下圖所示,63美元的水平對GameStop非常重要。峯值形成於2021年11月2日。經過一輪拋售之後,股票反彈並於2021年11月22日再次達到這個水平。然後再次逆轉並下跌。
On May 14 of this year, the shares blasted off on the news surrounding Roaring Kitty. The shares were up more than 100%. And once they reached levels around $63, they ran into resistance and reversed.
今年5月14日,因Roaring Kitty的消息而使股票飆升。股票上漲了100%以上。一旦它達到了大約63美元的水平,它就遇到了阻力並逆轉了。
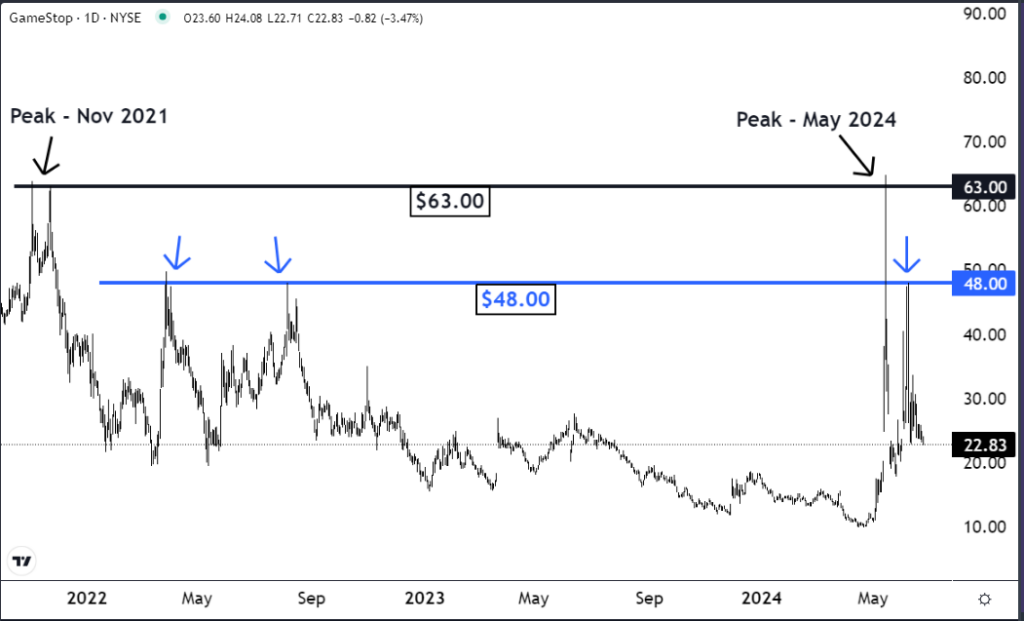
The same type of price action also took place around the important $48 level.
在重要的48美元水平周圍也發生了相同類型的價格行爲。
The level was first resistance in March 2022. Then it was resistance again in August 2022.
這個水平首先在2022年3月成爲了阻力位。然後在2022年8月再次成爲了阻力位。
On June 6 of this year, the stock took off again because of Roaring Kitty and the Reddit community. It ran into resistance around $43 and reversed again.
今年6月6日,股票因Roaring Kitty和Reddit社區再次起飛。 它遇到了大約43美元的阻力並再次逆轉了。
The Last Word: The term "market memory" refers to the fact that an important price level can retain its importance for a long time, for months or even years.
最後的話:"市場記憶"這個術語是指一個重要的價格水平可以長時間地保持其重要性,長達數月甚至數年。
Sometimes traders have profitable positions but they have a difficult time determining a sell target. It would be logical to consider having it at a price that had previously been a peak or top.
有時候交易商擁有有利的頭寸,但他們很難確定賣出目標。將其考慮爲之前的峯值或頂部價格是合乎邏輯的。
GME Price Action: GameStop shares were trading 1.3% lower Tuesday at $23.34.
GME股票價格:週二,GameStop股票以23.34美元的價格下跌了1.3%。
Related Link: What's Going On With AMC Entertainment Stock Monday?
相關連結:AMC Entertainment股票在週一發生了什麼?
Photo via Shutterstock.
圖片來自Shutterstock。
譯文內容由第三人軟體翻譯。