
Exact Sciences (NASDAQ:EXAS) Shareholders Are up 8.5% This Past Week, but Still in the Red Over the Last Three Years
Exact Sciences (NASDAQ:EXAS) Shareholders Are up 8.5% This Past Week, but Still in the Red Over the Last Three Years
Investing in stocks inevitably means buying into some companies that perform poorly. But the long term shareholders of Exact Sciences Corporation (NASDAQ:EXAS) have had an unfortunate run in the last three years. Sadly for them, the share price is down 66% in that time. And over the last year the share price fell 52%, so we doubt many shareholders are delighted. The falls have accelerated recently, with the share price down 31% in the last three months.
投資股票不可避免地意味着購買一些業績表現不佳的公司。但Exact Sciences Corporation (納斯達克代碼:EXAS)的長期股東近三年來遭遇了不幸的遭遇。不幸的是,股價在此期間下跌了66%。在過去一年中,股價下跌了52%,因此我們懷疑很少有股東感到高興。近期下跌加速,股價在過去三個月中下跌了31%。
While the stock has risen 8.5% in the past week but long term shareholders are still in the red, let's see what the fundamentals can tell us.
儘管最近一週股票上漲了8.5%,但長期股東仍然虧損,請看基本面能告訴我們什麼。
Exact Sciences isn't currently profitable, so most analysts would look to revenue growth to get an idea of how fast the underlying business is growing. When a company doesn't make profits, we'd generally hope to see good revenue growth. As you can imagine, fast revenue growth, when maintained, often leads to fast profit growth.
Exact Sciences目前沒有盈利,因此大多數分析師會從營收增長來了解基礎業務增長的速度。當公司不盈利時,我們通常希望看到良好的營收增長。正如您所想象的那樣,快速的營收增長,當得到保持時,通常會導致快速的利潤增長。
Over three years, Exact Sciences grew revenue at 16% per year. That's a pretty good rate of top-line growth. So some shareholders would be frustrated with the compound loss of 18% per year. To be frank we're surprised to see revenue growth and share price growth diverge so strongly. It would be well worth taking a closer look at the company, to determine growth trends (and balance sheet strength).
在過去的三年中,Exact Sciences的營業收入增長率達到了16%。這是一個相當不錯的營業收入增長率。因此,一些股東會對年複合虧損率爲18%感到失望。坦白地說,我們對營收增長和股價增長如此強烈地背道而馳感到驚訝。仔細研究公司確定增長趨勢(和資產負債表強度)是很值得的。
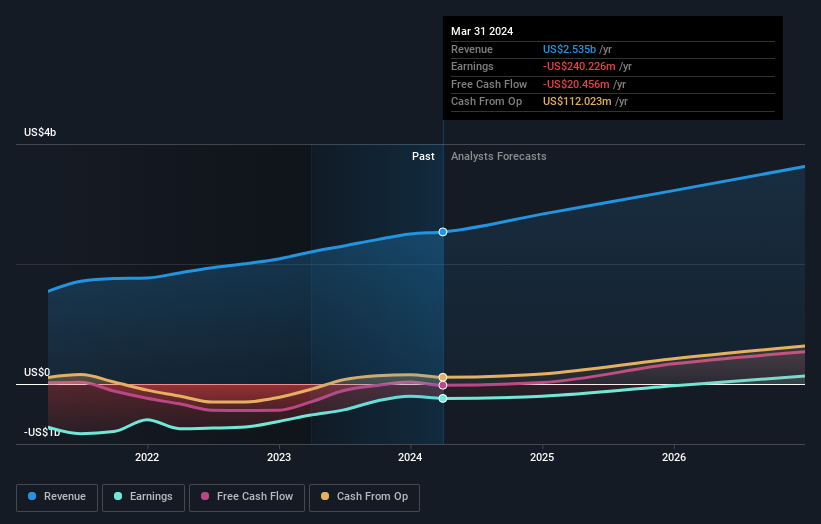
The graphic below depicts how earnings and revenue have changed over time (unveil the exact values by clicking on the image).
下面的圖表顯示了收益和營收隨時間的變化情況(通過單擊圖像揭示確切的值)。
Exact Sciences is a well known stock, with plenty of analyst coverage, suggesting some visibility into future growth. Given we have quite a good number of analyst forecasts, it might be well worth checking out this free chart depicting consensus estimates.
Exact Sciences是一家知名的股票公司,有很多分析師的報道,這表明有些未來增長可見。考慮到我們有相當數量的分析師預測,檢查這個展示共識估計的免費圖表可能很值得一試。
A Different Perspective
不同的觀點
Investors in Exact Sciences had a tough year, with a total loss of 52%, against a market gain of about 26%. However, keep in mind that even the best stocks will sometimes underperform the market over a twelve month period. Regrettably, last year's performance caps off a bad run, with the shareholders facing a total loss of 10% per year over five years. Generally speaking long term share price weakness can be a bad sign, though contrarian investors might want to research the stock in hope of a turnaround. I find it very interesting to look at share price over the long term as a proxy for business performance. But to truly gain insight, we need to consider other information, too. Consider risks, for instance. Every company has them, and we've spotted 1 warning sign for Exact Sciences you should know about.
Exact Sciences的投資者經歷了艱難的一年,總虧損爲52%,而市場則增長了約26%。然而,請記住,即使是最好的股票有時也會在十二個月的期間內表現不佳。可悔的是,去年的表現結束了一段糟糕的時期,股東在五年內面臨了每年總虧損10%。一般來說,長期股價疲軟可能是一個不好的信號,儘管反對派投資者可能希望研究股票,希望逆轉。我認爲,長期觀察股價作爲業務表現的代理非常有趣。但是,爲了真正獲得洞察力,我們還需要考慮其他信息。考慮到風險。每家公司都有風險,而我們已經發現了Exact Sciences的1個警告信號,您應該知道。
We will like Exact Sciences better if we see some big insider buys. While we wait, check out this free list of undervalued stocks (mostly small caps) with considerable, recent, insider buying.
如果我們看到一些大的內部人員購買,我們會更喜歡Exact Sciences。在等待時,請檢查這個免費的低估股票列表(大多數是小盤股),其中包含相當數量的最近內部購買。
Please note, the market returns quoted in this article reflect the market weighted average returns of stocks that currently trade on American exchanges.
請注意,本文所引述的市場回報反映了目前在美國交易所上市的股票的市場加權平均回報。
Have feedback on this article? Concerned about the content? Get in touch with us directly. Alternatively, email editorial-team (at) simplywallst.com.
This article by Simply Wall St is general in nature. We provide commentary based on historical data and analyst forecasts only using an unbiased methodology and our articles are not intended to be financial advice. It does not constitute a recommendation to buy or sell any stock, and does not take account of your objectives, or your financial situation. We aim to bring you long-term focused analysis driven by fundamental data. Note that our analysis may not factor in the latest price-sensitive company announcements or qualitative material. Simply Wall St has no position in any stocks mentioned.
對本文有反饋?關於內容有所顧慮?直接和我們聯繫。或者,發送電子郵件至editorial-team (at) simplywallst.com。
這篇文章是Simply Wall St的一般性文章。我們根據歷史數據和分析師預測提供評論,只使用公正的方法論,我們的文章並不意味着提供任何金融建議。文章不構成買賣任何股票的建議,也不考慮您的目標或您的財務狀況。我們的目標是帶給您基本數據驅動的長期關注分析。請注意,我們的分析可能不考慮最新的價格敏感公司公告或定性材料。Simply Wall St沒有任何股票頭寸。
Have feedback on this article? Concerned about the content? Get in touch with us directly. Alternatively, email editorial-team@simplywallst.com
對本文有反饋?關於內容有所顧慮?直接和我們聯繫。或者發送電子郵件至editorial-team@simplywallst.com。
譯文內容由第三人軟體翻譯。