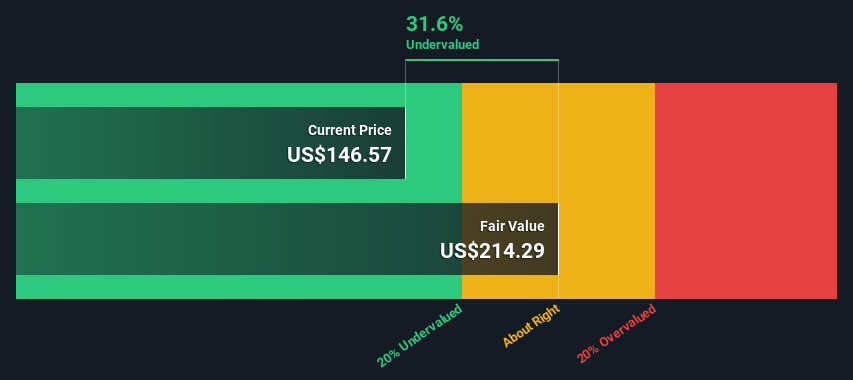
The projected fair value for Leidos Holdings is US$214 based on 2 Stage Free Cash Flow to Equity
Current share price of US$147 suggests Leidos Holdings is potentially 32% undervalued
The US$160 analyst price target for LDOS is 26% less than our estimate of fair value
Does the June share price for Leidos Holdings, Inc. (NYSE:LDOS) reflect what it's really worth? Today, we will estimate the stock's intrinsic value by taking the expected future cash flows and discounting them to their present value. We will use the Discounted Cash Flow (DCF) model on this occasion. It may sound complicated, but actually it is quite simple!
Companies can be valued in a lot of ways, so we would point out that a DCF is not perfect for every situation. If you still have some burning questions about this type of valuation, take a look at the Simply Wall St analysis model.
Step By Step Through The Calculation
We're using the 2-stage growth model, which simply means we take in account two stages of company's growth. In the initial period the company may have a higher growth rate and the second stage is usually assumed to have a stable growth rate. To begin with, we have to get estimates of the next ten years of cash flows. Where possible we use analyst estimates, but when these aren't available we extrapolate the previous free cash flow (FCF) from the last estimate or reported value. We assume companies with shrinking free cash flow will slow their rate of shrinkage, and that companies with growing free cash flow will see their growth rate slow, over this period. We do this to reflect that growth tends to slow more in the early years than it does in later years.
A DCF is all about the idea that a dollar in the future is less valuable than a dollar today, so we need to discount the sum of these future cash flows to arrive at a present value estimate:
10-year free cash flow (FCF) forecast
2024
2025
2026
2027
2028
2029
2030
2031
2032
2033
Levered FCF ($, Millions)
US$1.10b
US$1.17b
US$1.32b
US$1.37b
US$1.42b
US$1.47b
US$1.51b
US$1.55b
US$1.60b
US$1.64b
Growth Rate Estimate Source
Analyst x7
Analyst x8
Analyst x3
Est @ 4.14%
Est @ 3.61%
Est @ 3.24%
Est @ 2.98%
Est @ 2.80%
Est @ 2.67%
Est @ 2.59%
Present Value ($, Millions) Discounted @ 6.9%
US$1.0k
US$1.0k
US$1.1k
US$1.1k
US$1.0k
US$985
US$949
US$913
US$877
US$842
("Est" = FCF growth rate estimated by Simply Wall St) Present Value of 10-year Cash Flow (PVCF) = US$9.8b
After calculating the present value of future cash flows in the initial 10-year period, we need to calculate the Terminal Value, which accounts for all future cash flows beyond the first stage. The Gordon Growth formula is used to calculate Terminal Value at a future annual growth rate equal to the 5-year average of the 10-year government bond yield of 2.4%. We discount the terminal cash flows to today's value at a cost of equity of 6.9%.
Present Value of Terminal Value (PVTV)= TV / (1 + r)10= US$37b÷ ( 1 + 6.9%)10= US$19b
The total value, or equity value, is then the sum of the present value of the future cash flows, which in this case is US$29b. To get the intrinsic value per share, we divide this by the total number of shares outstanding. Compared to the current share price of US$147, the company appears quite undervalued at a 32% discount to where the stock price trades currently. The assumptions in any calculation have a big impact on the valuation, so it is better to view this as a rough estimate, not precise down to the last cent.
NYSE:LDOS Discounted Cash Flow June 24th 2024
Important Assumptions
We would point out that the most important inputs to a discounted cash flow are the discount rate and of course the actual cash flows. If you don't agree with these result, have a go at the calculation yourself and play with the assumptions. The DCF also does not consider the possible cyclicality of an industry, or a company's future capital requirements, so it does not give a full picture of a company's potential performance. Given that we are looking at Leidos Holdings as potential shareholders, the cost of equity is used as the discount rate, rather than the cost of capital (or weighted average cost of capital, WACC) which accounts for debt. In this calculation we've used 6.9%, which is based on a levered beta of 0.976. Beta is a measure of a stock's volatility, compared to the market as a whole. We get our beta from the industry average beta of globally comparable companies, with an imposed limit between 0.8 and 2.0, which is a reasonable range for a stable business.
SWOT Analysis for Leidos Holdings
Strength
Debt is well covered by earnings and cashflows.
Dividends are covered by earnings and cash flows.
Dividend information for LDOS.
Weakness
Earnings declined over the past year.
Dividend is low compared to the top 25% of dividend payers in the Professional Services market.
Opportunity
Annual earnings are forecast to grow faster than the American market.
Trading below our estimate of fair value by more than 20%.
Threat
Annual revenue is forecast to grow slower than the American market.
What else are analysts forecasting for LDOS?
Looking Ahead:
Although the valuation of a company is important, it ideally won't be the sole piece of analysis you scrutinize for a company. The DCF model is not a perfect stock valuation tool. Rather it should be seen as a guide to "what assumptions need to be true for this stock to be under/overvalued?" For example, changes in the company's cost of equity or the risk free rate can significantly impact the valuation. What is the reason for the share price sitting below the intrinsic value? For Leidos Holdings, there are three fundamental elements you should explore:
Risks: For example, we've discovered 3 warning signs for Leidos Holdings that you should be aware of before investing here.
Future Earnings: How does LDOS's growth rate compare to its peers and the wider market? Dig deeper into the analyst consensus number for the upcoming years by interacting with our free analyst growth expectation chart.
Other High Quality Alternatives: Do you like a good all-rounder? Explore our interactive list of high quality stocks to get an idea of what else is out there you may be missing!
PS. Simply Wall St updates its DCF calculation for every American stock every day, so if you want to find the intrinsic value of any other stock just search here.
Have feedback on this article? Concerned about the content?Get in touch with us directly. Alternatively, email editorial-team (at) simplywallst.com. This article by Simply Wall St is general in nature. We provide commentary based on historical data and analyst forecasts only using an unbiased methodology and our articles are not intended to be financial advice. It does not constitute a recommendation to buy or sell any stock, and does not take account of your objectives, or your financial situation. We aim to bring you long-term focused analysis driven by fundamental data. Note that our analysis may not factor in the latest price-sensitive company announcements or qualitative material. Simply Wall St has no position in any stocks mentioned.
Have feedback on this article? Concerned about the content? Get in touch with us directly. Alternatively, email editorial-team@simplywallst.com
主要見解
根據兩階段自由現金流到股票的模型,Leidos Holdings 的預測公允價值爲214美元。
根據當前的股價147美元,Leidos Holdings 可能被低估了32%。
LDOS 的目標價爲160美元,比我們預計的公允價值低了26%。
6月份 Leidos Holdings, Inc. (NYSE:LDOS) 的股價是否反映了其真實價值?今天,我們將通過預期的未來現金流折現到現值來估算該股票的內在價值。這次我們將使用貼現現金流模型(DCF)。這聽起來很複雜,但實際上很簡單!