
Growth Stocks Leave Value Stocks In The Dust: 4 Reasons For Biggest Monthly Lead In Over A Year
Growth Stocks Leave Value Stocks In The Dust: 4 Reasons For Biggest Monthly Lead In Over A Year
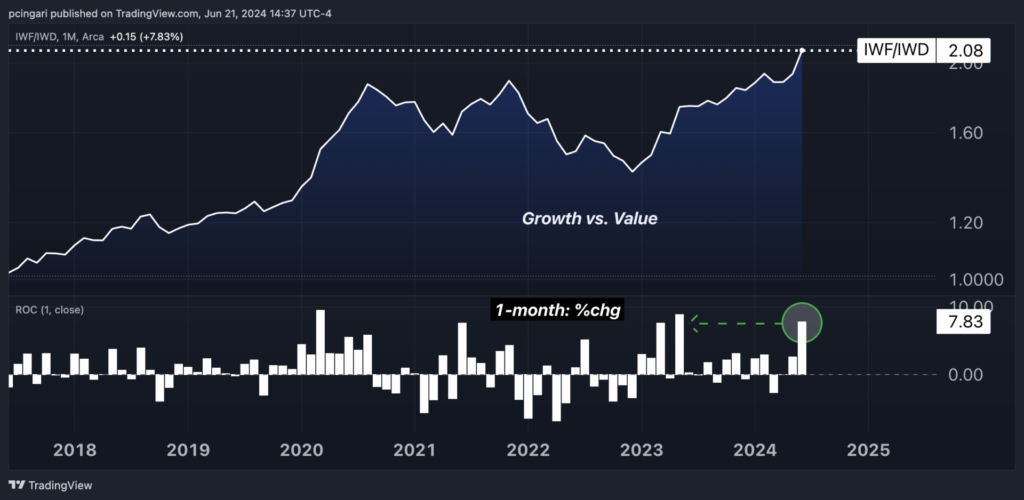
Growth stocks are experiencing a remarkable resurgence, posting their best month in over a year when compared to value stocks, as the rally in tech and mega caps continues to dominate market dynamics.
與價值型股票相比,成長型股票正在經歷一個顯着的復甦,市場動態仍由科技和大型公司主導,成長股已經跑贏價值股約一年多的時間。
The iShares Russell 1000 Growth ETF (NYSE:IWF) has surged by 6.5% so far in June 2024. This gain puts it on track for its seventh month of increases in the last eight.
iShares羅素1000成長型ETF(NYSE:IWF)在2024年6月迄今已上漲了6.5%。 這種漲幅使其在過去的8個月中出現了7個月的增長。
Investors have shown elevated confidence in growth-oriented sectors, particularly technology, which continues to benefit from strong earnings reports, heightened expectations for future cash flows and positive market sentiment, especially towards AI-related industries.
投資者對成長型領域特別是科技領域表現出了極高的信心,這些領域受益於強勁的業績、對未來現金流的高預期以及股市對人工智能相關行業的積極情緒。 與此形成鮮明對比的是,代表另一個主要股票分組的iShares羅素1000價值型ETF(NYSE:IWD)在6月下跌了1.4%。
In stark contrast, the iShares Russell 1000 Value ETF (NYSE:IWD), representing the other major equity style, has declined by 1.4% in June.
這種分化凸顯出價值型股票面臨的挑戰,通常包括金融,能源,公用事業和消費這些板塊。 這些板塊由於表現不佳和盈利預期低迷而難以吸引投資者的興趣。
This divergence highlights the challenges facing value stocks, which typically encompass sectors like financials, energy, utilities, and consumer staples. These sectors have struggled to attract investor interest due to their less impressive performance and subdued earnings expectations.
2024年6月成長股和價值股的表現差距達到了驚人的7.9個百分點,這是自2023年5月以來最爲顯著的月度表現差異。
The performance gap between growth and value in June 2024 stands at a striking 7.9 percentage points, marking the most substantial monthly performance difference since May 2023.
本月還剩一個交易周,如果差距超過2020年3月創下的9.6個百分點,這將標誌着創業板在一月內比價值股表現最好的記錄。
With one trading week remaining in the month, if the gap exceeds 9.6 percentage points, previously reached in March 2020, it will mark the largest one-month outperformance of growth over value ever recorded.
推動成長股超越價值股的4個關鍵因素
4 Key Factors Driving Growth's Outperformance Over Value
成長型ETF中科技板塊的主導地位:科技板塊在成長型ETF中的重要權重是推動其表現的主要驅動力。 在羅素1000成長型ETF中,科技股佔組合的47%。 與此形成鮮明對比的是,羅素1000價值型ETF僅分配了9.5%的科技股。
Technology Sector's Dominance in Growth ETFs: The technology sector's heavy weighting in growth-related ETFs has been the main driver of their outperformance. In the Russell 1000 Growth ETF, tech stocks comprise a substantial 47% of the portfolio. In stark contrast, the Russell 1000 Value ETF allocates only 9.5% to tech stocks.
芯片製造商對成長股表現的影響:在科技行業中,芯片製造商在成長基金中的重要權重是另一個關鍵因素,因爲它們是當前人工智能拉動下的主要受益者。 半導體板塊在成長ETF中佔17%,而在價值ETF中僅佔4.2%。
Impact of Chipmakers on Growth Performance: Within the tech sector, the substantial weighting of chipmakers in growth funds has been another critical factor, as they have been the main beneficiaries of the current AI-driven rally. The semiconductor sector represents 17% of the growth ETF, compared to a mere 4.2% in the value ETF.
成長股ETF中缺乏英偉達、美元6家公司:值得注意的是,美國銀行命名爲“卓越6家公司”的英偉達公司(NASDAQ:NVDA),微軟公司(NYSE:MSFT),蘋果公司(NASDAQ:AAPL),Alphabet Inc. (NASDAQ:GOOG)(NASDAQ:GOOGL),Amazon Inc.(NASDAQ:AMZN)和Meta Platforms Inc.(NASDAQ:META) - 在價值型ETF中缺席,但在成長型ETF中平均佔50%的權重。
Absence of Nvidia, Magnificent 6 In Value ETFs: Notably, "The Magnificent 6" – as named by Bank of America – Nvidia Corp. (NASDAQ:NVDA), Microsoft Corp. (NYSE:MSFT), Apple Inc. (NASDAQ:AAPL), Alphabet Inc. (NASDAQ:GOOG) (NASDAQ:GOOGL), Amazon Inc. (NASDAQ:AMZN), and Meta Platforms Inc. (NASDAQ:META) – are absent from the value-linked ETF but collectively hold a 50% weight in the growth ETF.
股票集中度和市場廣度差異:成長型ETF中較高的股票集中度與價值型ETF中股票集中度較低也是另一個至關重要的因素,特別是在當前市場廣度不足的情況下。羅素1000成長型ETF中的前10支股票佔整個投資組合的57%,而價值型ETF中前10支股票只佔總權重的17%。
Stock Concentration and Market Breadth Differences: The higher stock concentration in growth-related ETFs compared to value socks is another crucial factor, especially in the current context of poor market breadth. The top 10 stocks in the Russell 1000 Growth ETF comprise 57% of the overall portfolio, whereas the top 10 in the value-related ETF account for only 17% of the total weight.
6月份表現最佳的7支成長股
Top 7 Performing Growth Stocks In June
價格變化%(本月至今)
| Name | Price Chg. % (MTD) |
| Broadcom Inc. (NASDAQ:AVGO) | 26.85% |
| Texas Pacific Land Corporation (NYSE:TPL) | 22.95% |
| Sarepta Therapeutics, Inc. (NASDAQ:SRPT) | 22.88% |
| Adobe Inc. (NASDAQ:ADBE) | 19.95% |
| Oracle Corporation (NYSE:ORCL) | 19.91% |
| CrowdStrike Holdings, Inc. (NASDAQ:CRWD) | 19.48% |
| Autodesk, Inc. (NASDAQ:ADSK) | 19.04% |
| 姓名 | 價格變動百分比(當月) |
| broadcom corp 8.00% mandatory convertible prf sr a(納斯達克:AVGO) | 26.85% |
| Texas Pacific Land(紐交所:TPL) | 22.95% |
| Sarepta Therapeutics, Inc.(納斯達克:SRPT) | 22.88% |
| Adobe股份有限公司(納斯達克股票代碼: ADBE) | 19.95% |
| 甲骨文公司(紐交所:ORCL) | 19.91% |
| CrowdStrike Holdings, Inc. (納斯達克:CRWD) | 19.48% |
| Autodesk, Inc.(納斯達克:ADSK) | 19.04% |
Top 7 Performing Value Stocks In June
6月份表現最佳的7只價值股
| Name | Price Chg. % (MTD) |
| Coherent Corp. (NYSE:COHR) | 24.68% |
| DC Technology Company (NYSE:DXC) | 20.23% |
| Guidewire Software, Inc. (NYSE:GWRE) | 19.58% |
| Universal Display Corporation (NASDAQ:OLED) | 18.71% |
| Ollie's Bargain Outlet Holdings, Inc. (NASDAQ:OLLI) | 18.52% |
| Zillow Group, Inc. (NYSE:ZG) | 17.88% |
| Hewlett Packard Enterprise Company (NYSE:HPE) | 16.29% |
| 姓名 | 價格變動百分比(當月) |
| Coherent Corp.(紐交所:COHR) | 24.68% |
| DC Technology Company(紐交所:DXC) | 20.23% |
| Guidewire Software, Inc.(紐交所:GWRE) | 19.58% |
| Universal Display Corporation (納斯達克:oled概念) | 18.71% |
| Ollie's Bargain Outlet Holdings, Inc. (納斯達克:ollie's bargain outlet) | 18.52% |
| Zillow Group, Inc. (紐交所:ZG) | 17.88% |
| Hewlett Packard Enterprise Company(紐交所:慧與科技) | 16.29% |
Read now: 5 Charts Expose Troubling Weaknesses In Record-High Stock Market: 'This Is Not Normal'
立即閱讀:5張圖揭示創紀錄的股市存在令人擔憂的弱點:“這不是正常現象”
Image created using artificial intelligence via Midjourney.
圖像由Midjourney通過人工智能創建。
譯文內容由第三人軟體翻譯。