
Universal Display (NASDAQ:OLED) Shareholders Have Earned a 49% Return Over the Last Year
Universal Display (NASDAQ:OLED) Shareholders Have Earned a 49% Return Over the Last Year
If you want to compound wealth in the stock market, you can do so by buying an index fund. But if you pick the right individual stocks, you could make more than that. To wit, the Universal Display Corporation (NASDAQ:OLED) share price is 48% higher than it was a year ago, much better than the market return of around 23% (not including dividends) in the same period. If it can keep that out-performance up over the long term, investors will do very well! On the other hand, longer term shareholders have had a tougher run, with the stock falling 5.8% in three years.
如果您想在股市中合成財富,可以購買指數基金。但是,如果您選擇正確的個股,您可能會賺得更多。例如,Universal Display Corporation(納斯達克:oled概念)的股票價格比一年前高出48%,遠高於同期約23%的市場回報率(不包含分紅派息)。如果它能在長期內保持這種表現,那麼投資者將獲得非常好的回報!另一方面,長期股東的表現更爲艱難,股票在三年內下跌了5.8%。
So let's assess the underlying fundamentals over the last 1 year and see if they've moved in lock-step with shareholder returns.
那麼讓我們評估過去一年的基本面,並看看它們是否與股東回報同步變化。
While markets are a powerful pricing mechanism, share prices reflect investor sentiment, not just underlying business performance. One flawed but reasonable way to assess how sentiment around a company has changed is to compare the earnings per share (EPS) with the share price.
雖然市場是一個強大的定價機制,但股價反映了投資者情緒,不僅僅是基本業績。一種有缺陷但合理的評估公司周圍情緒如何變化的方法是將每股收益(EPS)與股價進行比較。
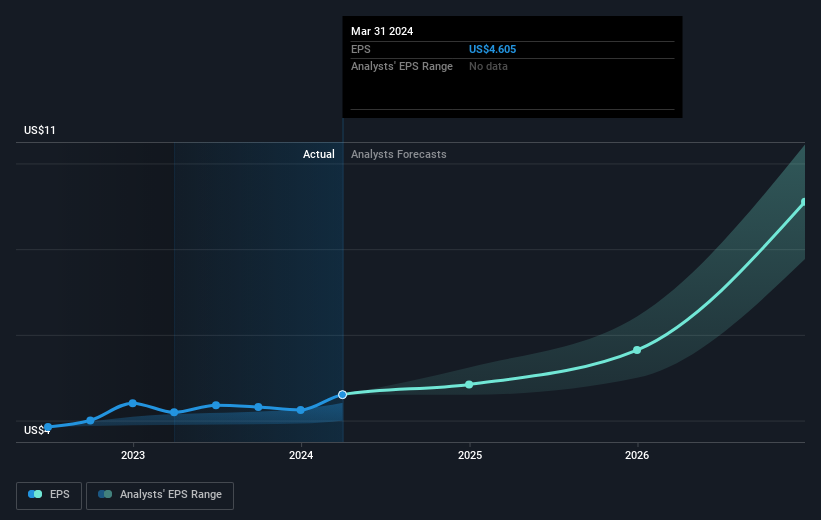
Universal Display was able to grow EPS by 9.8% in the last twelve months. The share price gain of 48% certainly outpaced the EPS growth. So it's fair to assume the market has a higher opinion of the business than it a year ago.
在過去的十二個月中,Universal Display的每股收益增長了9.8%。股價增長48%肯定超過了EPS的增長。因此,可以認爲市場對業務的看法比一年前更高。
The company's earnings per share (over time) is depicted in the image below (click to see the exact numbers).
該公司的每股收益(隨時間的推移)如下圖所示(單擊可查看確切數字)。
This free interactive report on Universal Display's earnings, revenue and cash flow is a great place to start, if you want to investigate the stock further.
如果您想進一步調查此股票,Universal Display的收益,營業收入和現金流的免費互動報告是一個好地方。
A Different Perspective
不同的觀點
It's good to see that Universal Display has rewarded shareholders with a total shareholder return of 49% in the last twelve months. And that does include the dividend. That's better than the annualised return of 3% over half a decade, implying that the company is doing better recently. Someone with an optimistic perspective could view the recent improvement in TSR as indicating that the business itself is getting better with time. While it is well worth considering the different impacts that market conditions can have on the share price, there are other factors that are even more important. Take risks, for example - Universal Display has 2 warning signs (and 1 which makes us a bit uncomfortable) we think you should know about.
很高興看到Universal Display在過去十二個月內爲股東帶來了總股東回報率爲49%的回報。這也包括分紅派息。這比過去半個十年的年化回報率3%要好,表明該公司最近表現更好。有樂觀看法的人可能會認爲TSR近期的改善表明業務本身隨着時間的推移正在變得更好。儘管值得考慮市場條件可能對股價產生的不同影響,但有其他更重要的因素。例如承擔風險 - Universal Display有2個警告標誌(和1個讓我們有點不舒服的標誌)我們認爲您應該知道。
Of course Universal Display may not be the best stock to buy. So you may wish to see this free collection of growth stocks.
當然,Universal Display可能不是最好的股票購買選擇。因此,您可能希望查看這些成長股的免費集合。
Please note, the market returns quoted in this article reflect the market weighted average returns of stocks that currently trade on American exchanges.
請注意,本文所引述的市場回報反映了目前在美國交易所上市的股票的市場加權平均回報。
Have feedback on this article? Concerned about the content? Get in touch with us directly. Alternatively, email editorial-team (at) simplywallst.com.
This article by Simply Wall St is general in nature. We provide commentary based on historical data and analyst forecasts only using an unbiased methodology and our articles are not intended to be financial advice. It does not constitute a recommendation to buy or sell any stock, and does not take account of your objectives, or your financial situation. We aim to bring you long-term focused analysis driven by fundamental data. Note that our analysis may not factor in the latest price-sensitive company announcements or qualitative material. Simply Wall St has no position in any stocks mentioned.
對本文有反饋?關於內容有所顧慮?直接和我們聯繫。或者,發送電子郵件至editorial-team (at) simplywallst.com。
這篇文章是Simply Wall St的一般性文章。我們根據歷史數據和分析師預測提供評論,只使用公正的方法論,我們的文章並不意味着提供任何金融建議。文章不構成買賣任何股票的建議,也不考慮您的目標或您的財務狀況。我們的目標是帶給您基本數據驅動的長期關注分析。請注意,我們的分析可能不考慮最新的價格敏感公司公告或定性材料。Simply Wall St沒有任何股票頭寸。
Have feedback on this article? Concerned about the content? Get in touch with us directly. Alternatively, email editorial-team@simplywallst.com
對本文有反饋?關於內容有所顧慮?直接和我們聯繫。或者發送電子郵件至editorial-team@simplywallst.com。
譯文內容由第三人軟體翻譯。