
Verrica Pharmaceuticals (NASDAQ:VRCA Investor Three-year Losses Grow to 38% as the Stock Sheds US$57m This Past Week
Verrica Pharmaceuticals (NASDAQ:VRCA Investor Three-year Losses Grow to 38% as the Stock Sheds US$57m This Past Week
It is doubtless a positive to see that the Verrica Pharmaceuticals Inc. (NASDAQ:VRCA) share price has gained some 44% in the last three months. But that doesn't help the fact that the three year return is less impressive. In fact, the share price is down 38% in the last three years, falling well short of the market return.
Verrica製藥股票(納斯達克:VRCA)近三個月已上漲了44%,這無疑是一個積極的跡象,但三年回報率卻不太令人印象深刻。事實上,股價在過去三年中下跌了38%,遠遠低於市場回報率。
Given the past week has been tough on shareholders, let's investigate the fundamentals and see what we can learn.
考慮到過去一週對股東來說是艱難的,讓我們調查一下基本面並看看我們能學到什麼。
Verrica Pharmaceuticals wasn't profitable in the last twelve months, it is unlikely we'll see a strong correlation between its share price and its earnings per share (EPS). Arguably revenue is our next best option. When a company doesn't make profits, we'd generally hope to see good revenue growth. That's because it's hard to be confident a company will be sustainable if revenue growth is negligible, and it never makes a profit.
在過去的十二個月中,Verrica製藥未盈利,因此其股價和每股收益(EPS)之間的關係不大可能強烈相關。可以看作營業收入是我們下個最好的選擇。當公司不盈利時,我們通常希望看到良好的營收增長。因爲如果營收增長微不足道,並且永遠不盈利,很難有信心認爲公司能夠持續存在。
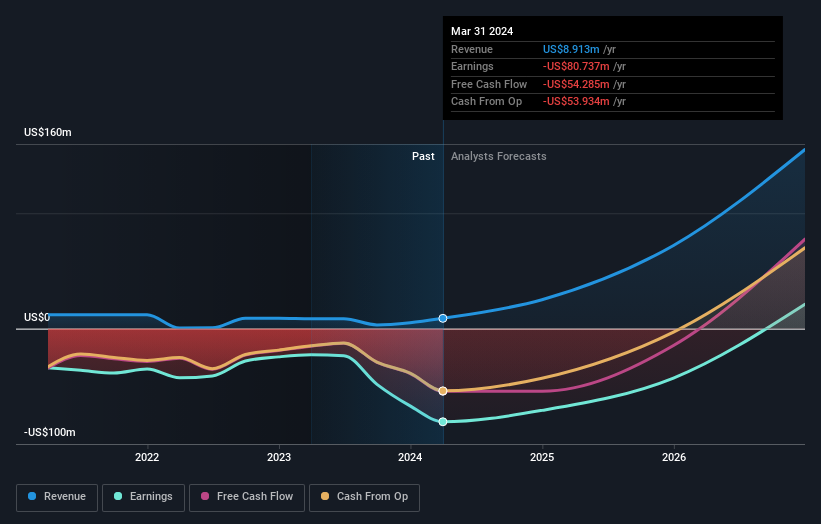
Over the last three years, Verrica Pharmaceuticals' revenue dropped 21% per year. That means its revenue trend is very weak compared to other loss making companies. With revenue in decline, the share price decline of 11% per year is hardly undeserved. The key question now is whether the company has the capacity to fund itself to profitability, without more cash. The company will need to return to revenue growth as quickly as possible, if it wants to see some enthusiasm from investors.
在過去三年中,Verrica製藥的營業收入每年下降21%。這意味着與其他虧損的公司相比,它的營業收入趨勢非常弱。隨着營業收入的下降,每年11%的股價下降幾乎是應得的。現在的關鍵問題是,公司是否有資金支持自身盈利而無需更多現金。如果公司想要看到投資者的熱情,它需要儘快恢復營收增長。
You can see how earnings and revenue have changed over time in the image below (click on the chart to see the exact values).
你可以在下面的圖片中看到收入和營業收入隨時間的變化情況(單擊圖表可查看精確值)。
We like that insiders have been buying shares in the last twelve months. Having said that, most people consider earnings and revenue growth trends to be a more meaningful guide to the business. If you are thinking of buying or selling Verrica Pharmaceuticals stock, you should check out this free report showing analyst profit forecasts.
我們喜歡看到內部人員在過去的十二個月中購買了股票。話雖如此,大多數人認爲盈利和營收增長趨勢是業務更有意義的指標。如果您考慮購買或出售Verrica製藥的股票,您應該查看這份免費的報告,其中顯示了分析師的盈利預測。
A Different Perspective
不同的觀點
Verrica Pharmaceuticals provided a TSR of 18% over the last twelve months. Unfortunately this falls short of the market return. On the bright side, that's still a gain, and it is certainly better than the yearly loss of about 5% endured over half a decade. It could well be that the business is stabilizing. I find it very interesting to look at share price over the long term as a proxy for business performance. But to truly gain insight, we need to consider other information, too. For instance, we've identified 2 warning signs for Verrica Pharmaceuticals (1 shouldn't be ignored) that you should be aware of.
在過去十二個月中,Verrica製藥提供了18%的TSR。不幸的是,這仍然低於市場回報率。好的一面是,這仍然是一個收益,肯定比過去五年中每年約5%的虧損好。很可能該業務正在穩定。我發現用長期股價作爲業務表現的代理非常有趣。但要真正獲得洞察力,我們還需要考慮其他信息。例如,我們已經確定了Verrica製藥的兩個警示信號(其中有一個不應被忽視),您應該注意。
If you like to buy stocks alongside management, then you might just love this free list of companies. (Hint: most of them are flying under the radar).
如果您喜歡與管理層共同購買股票,那麼您可能會喜歡這個免費的公司列表(提示:大多數公司沒有受到關注)。
Please note, the market returns quoted in this article reflect the market weighted average returns of stocks that currently trade on American exchanges.
請注意,本文所引述的市場回報反映了目前在美國交易所上市的股票的市場加權平均回報。
Have feedback on this article? Concerned about the content? Get in touch with us directly. Alternatively, email editorial-team (at) simplywallst.com.
This article by Simply Wall St is general in nature. We provide commentary based on historical data and analyst forecasts only using an unbiased methodology and our articles are not intended to be financial advice. It does not constitute a recommendation to buy or sell any stock, and does not take account of your objectives, or your financial situation. We aim to bring you long-term focused analysis driven by fundamental data. Note that our analysis may not factor in the latest price-sensitive company announcements or qualitative material. Simply Wall St has no position in any stocks mentioned.
對本文有反饋?關於內容有所顧慮?直接和我們聯繫。或者,發送電子郵件至editorial-team (at) simplywallst.com。
這篇文章是Simply Wall St的一般性文章。我們根據歷史數據和分析師預測提供評論,只使用公正的方法論,我們的文章並不意味着提供任何金融建議。文章不構成買賣任何股票的建議,也不考慮您的目標或您的財務狀況。我們的目標是帶給您基本數據驅動的長期關注分析。請注意,我們的分析可能不考慮最新的價格敏感公司公告或定性材料。Simply Wall St沒有任何股票頭寸。
Have feedback on this article? Concerned about the content? Get in touch with us directly. Alternatively, email editorial-team@simplywallst.com
對本文有反饋?關於內容有所顧慮?直接和我們聯繫。或者發送電子郵件至editorial-team@simplywallst.com。
譯文內容由第三人軟體翻譯。