
Costco Stock At 52-Week High: Still Time To Buy?
Costco Stock At 52-Week High: Still Time To Buy?
Costco Wholesale Corp (NASDAQ:COST) has been on a stellar run, gaining 71.22% over the past year and 31.81% year-to-date. Trading around $870 per share Thursday morning, the stock reached a new high of $873.96 during intraday trading on June 18.
好市多批發公司(納斯達克股票代碼:COST)的股票一路狂奔,過去一年上漲了71.22%,今年迄今已上漲31.81%。週四上午,股票交易價格約爲870美元,股價在6月18日的盤中交易中創下新高,爲873.96美元。
This impressive performance has caught the attention of investors and analysts alike, prompting a closer look at the stock's technical indicators to determine if it's still a bullish opportunity.
這種令人印象深刻的表現引起了投資者和分析師的注意,促使更加密切地關注該股票的技術指標以確定它是否仍具備看好的機會。
Technical Indicators Suggest A Bullish Trend
技術面分析顯示積極信號
Costco's stock is trading above its 5-, 20-, and 50-day exponential moving averages (EMAs), signaling a strong bullish trend.
好市多公司的股票交易價格高於其5日、20日和50日的指數移動平均線(EMA),表明存在強勁的看好趨勢。
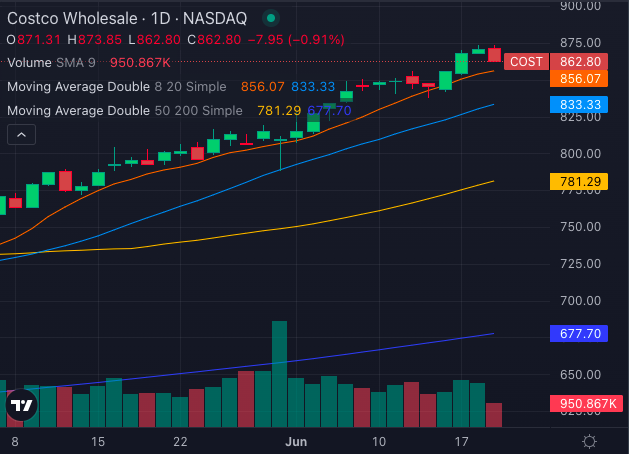
Chart: Benzinga Pro
圖表:Benzinga Pro
The stock's price is $862.80, while the 8-day simple moving average (SMA) is $856.07, indicating a bullish signal. Similarly, the 20-day SMA stands at $833.33, and the 50-day SMA is $781.29, both of which also signal bullishness.
該股票價格爲862.80美元,而8日的簡單移動平均線(SMA)爲856.07美元,表明存在看好信號。同樣,20日SMA爲833.33美元,50日SMA爲781.29美元,這兩項也表明看好。
The long-term trend is equally positive, with Costco's 200-day SMA at $677.70, significantly below its current trading price, reinforcing the bullishness.
長期趨勢同樣積極,好市多公司的200日SMA爲677.70美元,顯著低於當前的交易價格,進一步加強了看好性。
Also Read: Here's How Much $1000 Invested In Costco Wholesale 20 Years Ago Would Be Worth Today
閱讀更多:投資好市多20年前的1000美元今天值多少錢
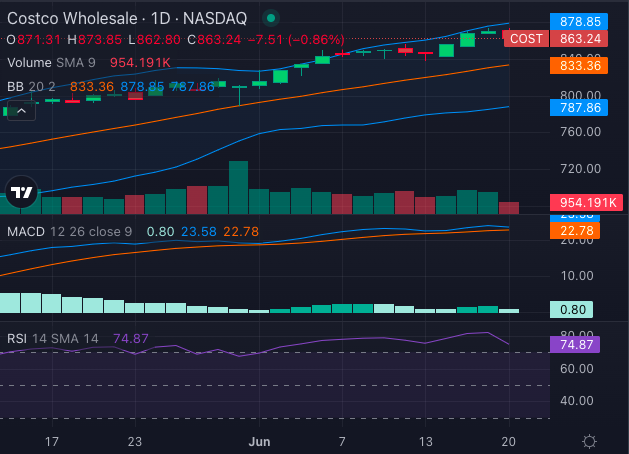
Chart: Benzinga Pro
圖表:Benzinga Pro
The Moving Average Convergence Divergence (MACD) indicator is at 23.58, suggesting strong bullish momentum. However, the Relative Strength Index (RSI) of 74.87 indicates that the stock is overbought, which could imply a potential for short-term price corrections.
移動平均線收斂/拓展(MACD)指標爲23.58,表明存在強勁的看好動能。然而,相對強弱指數(RSI)爲74.87,表明該股票處於超買狀態,可能意味着短期內有價格糾正的潛力。
Further reinforcing the bullish outlook, Costco's Bollinger Bands (20) are between $787.86 and $878.85. This range suggest that Costco is trading well above its recent average prices, indicating strong demand and bullish signals.
進一步加強看好前景,好市多公司的布林帶(20)介於787.86美元和878.85美元之間。該區間表明好市多公司的交易價格遠高於其最近的平均價格,表明存在強勁的需求和看好信號。
Analysts See Further Upside Potential
分析師認爲還有進一步上行的潛力
The last three analyst ratings from Evercore ISI Group, Loop Capital and Oppenheimer released on June 6 onwards have an average price target of $911.67 for the stock. This implies a 4.88% upside from the current price. These ratings underscore the market's confidence in Costco's continued growth.
Evercore、Loop Capital和Oppenheimer自6月6日以來發布的最後三項分析師評級平均目標價爲911.67美元。這意味着距離目前的價格還有4.88%的上漲空間。這些評級強調了市場對好市多持續增長的信心。
Costco's stock reached a 52-week high Thursday, bolstered by strong technical indicators and positive analyst ratings. Despite the RSI suggesting that the stock is overbought, the overall trend remains bullish. For investors considering entering or increasing their position in Costco, the current technical analysis supports a bullish outlook, with potential for further gains. However, it's also important to stay vigilant for any short-term corrections due to the overbought conditions.
好市多的股票週四創下52周新高,得益於強勁的技術指標和積極的分析師評級。儘管RSI表明該股票處於超買狀態,但總體趨勢仍然看好。對於考慮進入或增加其在好市多的持倉的投資者而言,當前的技術面分析支持看好前景,存在進一步的上漲潛力。然而,也非常重要的是要時刻保持警惕,以防由於超買條件而出現短期的糾正。
Photo: Shutterstock
Photo: shutterstock
譯文內容由第三人軟體翻譯。