
An Intrinsic Calculation For Silicon Laboratories Inc. (NASDAQ:SLAB) Suggests It's 31% Undervalued
An Intrinsic Calculation For Silicon Laboratories Inc. (NASDAQ:SLAB) Suggests It's 31% Undervalued
Key Insights
主要見解
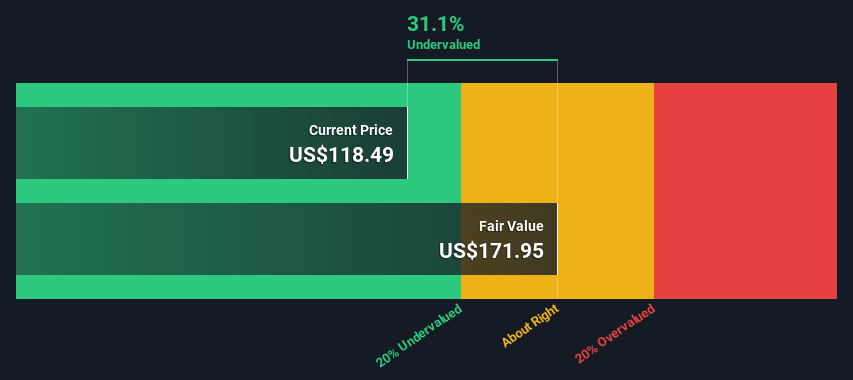
- Using the 2 Stage Free Cash Flow to Equity, Silicon Laboratories fair value estimate is US$172
- Silicon Laboratories' US$118 share price signals that it might be 31% undervalued
- The US$141 analyst price target for SLAB is 18% less than our estimate of fair value
- 使用2階段自由現金流對股權進行估值,芯科實驗室公平價值估計爲172美元。
- 芯科實驗室的美元118元的股價表明它可能被低估了31%。
- SLAB的141美元分析師價格目標比我們的公平價值估計低18%。
How far off is Silicon Laboratories Inc. (NASDAQ:SLAB) from its intrinsic value? Using the most recent financial data, we'll take a look at whether the stock is fairly priced by estimating the company's future cash flows and discounting them to their present value. This will be done using the Discounted Cash Flow (DCF) model. There's really not all that much to it, even though it might appear quite complex.
芯科實驗室股票的內在價值偏離有多大?使用最新的財務數據,我們將通過估計公司未來的現金流並將它們折現到當前價值來研究這隻股票是否定價合理。這將使用折現現金流(DCF)模型完成。雖然它可能看起來相當複雜,但實際上並沒有那麼複雜。
Remember though, that there are many ways to estimate a company's value, and a DCF is just one method. If you still have some burning questions about this type of valuation, take a look at the Simply Wall St analysis model.
記住,估算公司價值的方法有很多種,DCF只是其中一種方法。如果您對這種估值方法還有一些疑問,請查看Simply Wall St分析模型。
The Method
方法
We are going to use a two-stage DCF model, which, as the name states, takes into account two stages of growth. The first stage is generally a higher growth period which levels off heading towards the terminal value, captured in the second 'steady growth' period. In the first stage we need to estimate the cash flows to the business over the next ten years. Where possible we use analyst estimates, but when these aren't available we extrapolate the previous free cash flow (FCF) from the last estimate or reported value. We assume companies with shrinking free cash flow will slow their rate of shrinkage, and that companies with growing free cash flow will see their growth rate slow, over this period. We do this to reflect that growth tends to slow more in the early years than it does in later years.
我們將採用兩階段DCF模型,正如其名稱所示,該模型考慮了兩個增長階段。第一階段通常是一個更高的增長期,隨着進入第二個“穩定期”,增長率趨於穩定。在第一階段,我們需要估計未來十年業務的現金流。在可能的情況下,我們使用分析師的估計,但當這些估計不可用時,我們根據最後一個估計值或報告值的自由現金流(FCF)進行推斷。我們假設自由現金流收縮的公司將減緩其收縮速度,並且自由現金流增長的公司在此期間內將看到其增長率放緩。我們這樣做是爲了反映增長傾向於在早期年份比在後期年份放緩。
Generally we assume that a dollar today is more valuable than a dollar in the future, so we discount the value of these future cash flows to their estimated value in today's dollars:
通常我們認爲今天的一美元比未來的一美元更有價值,因此我們將這些未來的現金流折現爲今天的估計價值:
10-year free cash flow (FCF) forecast
10年自由現金流(FCF)預測
| 2024 | 2025 | 2026 | 2027 | 2028 | 2029 | 2030 | 2031 | 2032 | 2033 | |
| Levered FCF ($, Millions) | -US$74.3m | US$62.2m | US$134.2m | US$198.6m | US$266.6m | US$332.5m | US$392.4m | US$444.7m | US$489.4m | US$527.3m |
| Growth Rate Estimate Source | Analyst x3 | Analyst x2 | Analyst x2 | Est @ 47.96% | Est @ 34.29% | Est @ 24.71% | Est @ 18.01% | Est @ 13.32% | Est @ 10.04% | Est @ 7.74% |
| Present Value ($, Millions) Discounted @ 8.5% | -US$68.5 | US$52.9 | US$105 | US$144 | US$178 | US$204 | US$222 | US$232 | US$236 | US$234 |
| 2024 | 2025 | 2026 | 2027 | 2028 | 2029 | 2030 | 2031 | 2032 | 2033 | |
| 槓桿自由現金流 ($, 百萬) | -7430萬美元 | 6,220萬美元 | 1.342億美元 | 1.986億美元 | 2.666億美元 | 3.325億美元 | 3.924億美元 | 4.447億美元 | 4.894億美元 | 5.273億美元 |
| 創業板增長率預測來源 | 分析師x3 | 分析師x2 | 分析師x2 | 估計值爲47.96% | 估計值爲34.29% | 估計值爲24.71% | 估計值爲18.01% | 估計值爲13.32% | 估計值爲10.04% | 以7.74%的速度增長 |
| 以8.5%折現的現值(百萬美元) | -68.5美元 | 美元52.9 | 105美元 | 144美元 | 178美元 | 204美元 | 222美元 | 232美元 | 236美元 | 美元234 |
("Est" = FCF growth rate estimated by Simply Wall St)
Present Value of 10-year Cash Flow (PVCF) = US$1.5b
("Est" = FCF增長率估計由Simply Wall St)
10年現金流的現值(PVCF)=1.5億美元
The second stage is also known as Terminal Value, this is the business's cash flow after the first stage. For a number of reasons a very conservative growth rate is used that cannot exceed that of a country's GDP growth. In this case we have used the 5-year average of the 10-year government bond yield (2.4%) to estimate future growth. In the same way as with the 10-year 'growth' period, we discount future cash flows to today's value, using a cost of equity of 8.5%.
第二階段也被稱爲終值,這是業務在第一階段之後的現金流。出於多種原因,使用非常保守的增長率,不能超過一個國家的GDP增長率。在這種情況下,我們使用10年期政府債券收益率的5年平均值(2.4%)來估計未來的增長。與10年的“增長”期相同,我們使用8.5%的權益成本將未來現金流折現爲今天的價格。
Terminal Value (TV)= FCF2033 × (1 + g) ÷ (r – g) = US$527m× (1 + 2.4%) ÷ (8.5%– 2.4%) = US$8.9b
終止價值(TV)= FCF2033 ×(1 + g)÷(r-g)=5.27億美元×(1 + 2.4%)÷(8.5%-2.4%)=89億美元
Present Value of Terminal Value (PVTV)= TV / (1 + r)10= US$8.9b÷ ( 1 + 8.5%)10= US$3.9b
終止價值現值(PVTV)= TV / (1 + r)10= 89億美元÷(1 + 8.5%)10=美元39億
The total value, or equity value, is then the sum of the present value of the future cash flows, which in this case is US$5.5b. The last step is to then divide the equity value by the number of shares outstanding. Compared to the current share price of US$118, the company appears quite undervalued at a 31% discount to where the stock price trades currently. Remember though, that this is just an approximate valuation, and like any complex formula - garbage in, garbage out.
其中,總價值,或者股本價值,是未來現金流的現值之和,本例中爲55億美元。最後一步是將股本價值除以已發行股票的數量。與當前股價118美元相比,該公司看起來相當被低估,目前股價折扣達31%。請記住,這只是一個大概的估值,就像任何複雜的公式一樣,垃圾進入,則垃圾出。
Important Assumptions
重要假設
We would point out that the most important inputs to a discounted cash flow are the discount rate and of course the actual cash flows. Part of investing is coming up with your own evaluation of a company's future performance, so try the calculation yourself and check your own assumptions. The DCF also does not consider the possible cyclicality of an industry, or a company's future capital requirements, so it does not give a full picture of a company's potential performance. Given that we are looking at Silicon Laboratories as potential shareholders, the cost of equity is used as the discount rate, rather than the cost of capital (or weighted average cost of capital, WACC) which accounts for debt. In this calculation we've used 8.5%, which is based on a levered beta of 1.320. Beta is a measure of a stock's volatility, compared to the market as a whole. We get our beta from the industry average beta of globally comparable companies, with an imposed limit between 0.8 and 2.0, which is a reasonable range for a stable business.
我們要指出,折現現金流的最重要輸入是折現率,當然還有真實的現金流。投資的一部分就是對公司未來業績進行自己的評估,因此自己嘗試計算並檢查自己的假設。DCF還沒有考慮行業的可能循環性,或者公司未來的資本需求,因此它沒有給出公司潛在表現的完整畫面。考慮到我們正在研究作爲潛在股東的Silicon Laboratories,所以使用的折現率是權益成本,而不是資本成本(或加權平均資本成本WACC),後者考慮了債務。在這個計算中,我們使用了8.5%,這是基於1.320的槓桿貝塔。Beta是衡量股票波動性的指標,與整個市場相比。我們從全球可比公司的行業平均貝塔中獲得我們的貝塔,施加了0.8到2.0之間的極限,這是一個穩定企業的合理範圍。
Moving On:
接下來:
Whilst important, the DCF calculation shouldn't be the only metric you look at when researching a company. DCF models are not the be-all and end-all of investment valuation. Preferably you'd apply different cases and assumptions and see how they would impact the company's valuation. For instance, if the terminal value growth rate is adjusted slightly, it can dramatically alter the overall result. What is the reason for the share price sitting below the intrinsic value? For Silicon Laboratories, we've compiled three important items you should assess:
雖然DCF計算很重要,但在研究公司時不應該只看這個指標。DCF模型不是投資估值的全部和結束。最好應用不同情境和假設,並查看它們如何影響公司的估值。例如,如果終值增長率略有調整,可能會極大地改變總結果。股價低於內在價值的原因是什麼?對於Silicon Laboratories,我們編制了三個您應該評估的重要項目:
- Financial Health: Does SLAB have a healthy balance sheet? Take a look at our free balance sheet analysis with six simple checks on key factors like leverage and risk.
- Future Earnings: How does SLAB's growth rate compare to its peers and the wider market? Dig deeper into the analyst consensus number for the upcoming years by interacting with our free analyst growth expectation chart.
- Other Solid Businesses: Low debt, high returns on equity and good past performance are fundamental to a strong business. Why not explore our interactive list of stocks with solid business fundamentals to see if there are other companies you may not have considered!
- 財務狀況:SLAB的資產負債表是否健康?請查看我們六個關鍵因素的免費資產負債表分析,例如槓桿率和風險。
- 未來收益:SLAB的增長率與其同行及更廣泛的市場相比如何?與我們的免費分析師增長預期圖表互動,更深入地了解未來幾年的分析師共識數字。
- 其他優秀企業:低負債,高股本回報率和良好的過去業績是構建強大企業基礎的基礎。爲什麼不探索我們交互式的股票列表,其中包括具有堅實業務基礎的其他公司?
PS. Simply Wall St updates its DCF calculation for every American stock every day, so if you want to find the intrinsic value of any other stock just search here.
PS. Simply Wall St每天都會更新其對每隻美國股票的折現現金流計算,因此,如果你想找到其他股票的內在價值,只需在此搜索即可。
Have feedback on this article? Concerned about the content? Get in touch with us directly. Alternatively, email editorial-team (at) simplywallst.com.
This article by Simply Wall St is general in nature. We provide commentary based on historical data and analyst forecasts only using an unbiased methodology and our articles are not intended to be financial advice. It does not constitute a recommendation to buy or sell any stock, and does not take account of your objectives, or your financial situation. We aim to bring you long-term focused analysis driven by fundamental data. Note that our analysis may not factor in the latest price-sensitive company announcements or qualitative material. Simply Wall St has no position in any stocks mentioned.
對本文有反饋?關於內容有所顧慮?直接和我們聯繫。或者,發送電子郵件至editorial-team (at) simplywallst.com。
這篇文章是Simply Wall St的一般性文章。我們根據歷史數據和分析師預測提供評論,只使用公正的方法論,我們的文章並不意味着提供任何金融建議。文章不構成買賣任何股票的建議,也不考慮您的目標或您的財務狀況。我們的目標是帶給您基本數據驅動的長期關注分析。請注意,我們的分析可能不考慮最新的價格敏感公司公告或定性材料。Simply Wall St沒有任何股票頭寸。
Have feedback on this article? Concerned about the content? Get in touch with us directly. Alternatively, email editorial-team@simplywallst.com
對本文有反饋?關於內容有所顧慮?直接和我們聯繫。或者發送電子郵件至editorial-team@simplywallst.com。
譯文內容由第三人軟體翻譯。