
The Total Return for XPEL (NASDAQ:XPEL) Investors Has Risen Faster Than Earnings Growth Over the Last Five Years
The Total Return for XPEL (NASDAQ:XPEL) Investors Has Risen Faster Than Earnings Growth Over the Last Five Years
It hasn't been the best quarter for XPEL, Inc. (NASDAQ:XPEL) shareholders, since the share price has fallen 30% in that time. But over five years returns have been remarkably great. To be precise, the stock price is 635% higher than it was five years ago, a wonderful performance by any measure. So we don't think the recent decline in the share price means its story is a sad one. The most important thing for savvy investors to consider is whether the underlying business can justify the share price gain. Unfortunately not all shareholders will have held it for the long term, so spare a thought for those caught in the 53% decline over the last twelve months. Anyone who held for that rewarding ride would probably be keen to talk about it.
對XPEL公司(納斯達克:XPEL)的股東來說,這可能不是最好的一個季度,因爲股價在那段時間內下跌了30%。但是,在過去的五年裏,股息回報率一直非常高。確切地說,股價比五年前高出635%,這是任何標準下的出色表現。所以,我們不認爲最近股價下跌意味着其故事是悲傷的。對於精明的投資者來說,最重要的是要考慮基礎業務是否能夠支撐股價的上漲。不幸的是,並非所有的股東都會長揸它,所以請爲那些在過去一年中損失了53%的股民着想。任何持有股票的人都可能熱衷於談論它的收益。
In light of the stock dropping 6.8% in the past week, we want to investigate the longer term story, and see if fundamentals have been the driver of the company's positive five-year return.
鑑於該股票在過去一週內下跌了6.8%,我們想調查更長期的情況,看看基本面是否是公司五年良好回報的驅動因素。
To paraphrase Benjamin Graham: Over the short term the market is a voting machine, but over the long term it's a weighing machine. One flawed but reasonable way to assess how sentiment around a company has changed is to compare the earnings per share (EPS) with the share price.
引用本傑明·格雷厄姆的話:短期內市場是一個投票機,但長期來看它是一個稱重機。評估公司周邊環境的情緒變化的一種有缺陷但合理的方法是將每股收益(EPS)與股價進行比較。
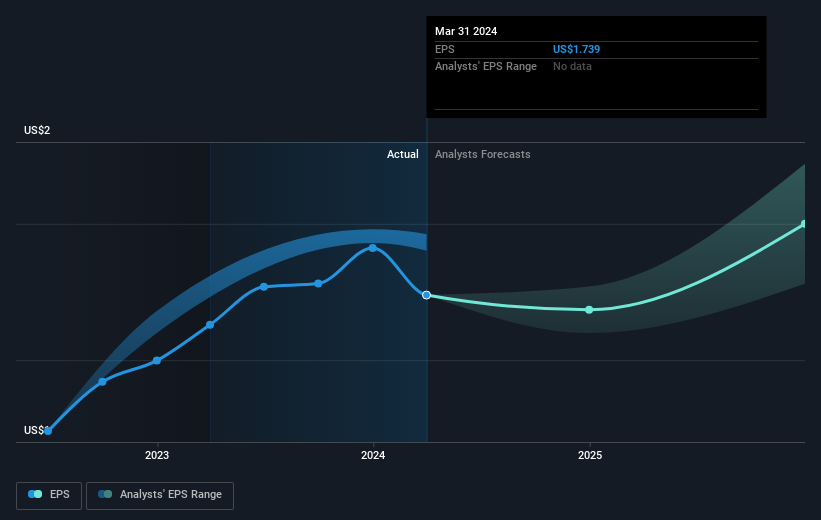
During five years of share price growth, XPEL achieved compound earnings per share (EPS) growth of 41% per year. So the EPS growth rate is rather close to the annualized share price gain of 49% per year. Therefore one could conclude that sentiment towards the shares hasn't morphed very much. In fact, the share price seems to largely reflect the EPS growth.
在五年的股票價格增長期間,XPEL公司實現了每股收益複合增長率(EPS)高達41%。因此,EPS增長率相當接近每股股價年化增長率爲49%。因此,人們可以得出結論,股票的情緒變化並不是很大。事實上,股價似乎在很大程度上反映了EPS的增長。
You can see below how EPS has changed over time (discover the exact values by clicking on the image).
下面可以看到每股收益隨時間的變化情況(通過點擊圖像來查看確切數值)。
It might be well worthwhile taking a look at our free report on XPEL's earnings, revenue and cash flow.
我們免費報告XPEL的收益、營業收入和現金流狀況值得一看。
A Different Perspective
不同的觀點
XPEL shareholders are down 53% for the year, but the market itself is up 24%. Even the share prices of good stocks drop sometimes, but we want to see improvements in the fundamental metrics of a business, before getting too interested. Longer term investors wouldn't be so upset, since they would have made 49%, each year, over five years. If the fundamental data continues to indicate long term sustainable growth, the current sell-off could be an opportunity worth considering. While it is well worth considering the different impacts that market conditions can have on the share price, there are other factors that are even more important. For example, we've discovered 1 warning sign for XPEL that you should be aware of before investing here.
XPEL股東的收益率爲當年下跌53%,但市場本身上漲了24%。即使好的股票價格有時會下跌,但在對一家企業的基本指標有所改善之前,我們希望看到業務基本數據方面的進展。長期投資者不會那麼沮喪,因爲他們每年都能獲得49%的收益率。如果基本數據繼續表明長期可持續增長,目前的拋售可能值得考慮。雖然考慮到市場狀況可能對股價產生不同的影響,但還有其他更重要的因素。例如,我們在此之前發現了一項XPEL的1個警告標誌,你在投資之前應該注意到。
Of course, you might find a fantastic investment by looking elsewhere. So take a peek at this free list of companies we expect will grow earnings.
當然,您可能在其他地方找到一家出色的企業進行投資。因此,請查看我們預計將實現盈利增長的公司的免費列表。
Please note, the market returns quoted in this article reflect the market weighted average returns of stocks that currently trade on American exchanges.
請注意,本文所引述的市場回報反映了目前在美國交易所上市的股票的市場加權平均回報。
Have feedback on this article? Concerned about the content? Get in touch with us directly. Alternatively, email editorial-team (at) simplywallst.com.
This article by Simply Wall St is general in nature. We provide commentary based on historical data and analyst forecasts only using an unbiased methodology and our articles are not intended to be financial advice. It does not constitute a recommendation to buy or sell any stock, and does not take account of your objectives, or your financial situation. We aim to bring you long-term focused analysis driven by fundamental data. Note that our analysis may not factor in the latest price-sensitive company announcements or qualitative material. Simply Wall St has no position in any stocks mentioned.
對本文有反饋?關於內容有所顧慮?直接和我們聯繫。或者,發送電子郵件至editorial-team (at) simplywallst.com。
這篇文章是Simply Wall St的一般性文章。我們根據歷史數據和分析師預測提供評論,只使用公正的方法論,我們的文章並不意味着提供任何金融建議。文章不構成買賣任何股票的建議,也不考慮您的目標或您的財務狀況。我們的目標是帶給您基本數據驅動的長期關注分析。請注意,我們的分析可能不考慮最新的價格敏感公司公告或定性材料。Simply Wall St沒有任何股票頭寸。
Have feedback on this article? Concerned about the content? Get in touch with us directly. Alternatively, email editorial-team@simplywallst.com
對本文有反饋?關於內容有所顧慮?直接和我們聯繫。或者發送電子郵件至editorial-team@simplywallst.com。
譯文內容由第三人軟體翻譯。