
Humana Inc.'s (NYSE:HUM) Stock Has Shown Weakness Lately But Financial Prospects Look Decent: Is The Market Wrong?
Humana Inc.'s (NYSE:HUM) Stock Has Shown Weakness Lately But Financial Prospects Look Decent: Is The Market Wrong?
With its stock down 1.9% over the past month, it is easy to disregard Humana (NYSE:HUM). But if you pay close attention, you might find that its key financial indicators look quite decent, which could mean that the stock could potentially rise in the long-term given how markets usually reward more resilient long-term fundamentals. In this article, we decided to focus on Humana's ROE.
隨着股價在過去一個月下跌1.9%,很容易忽視哈門那(紐交所:HUM)。 但是如果你仔細觀察,你可能會發現它的關鍵財務指標看起來相當不錯,這可能意味着股票在長期內有增長潛力,因爲市場通常獎勵更具有韌性的長期基本面。在本文中,我們決定關注哈門那的roe。
Return on Equity or ROE is a test of how effectively a company is growing its value and managing investors' money. Simply put, it is used to assess the profitability of a company in relation to its equity capital.
股東權益回報率(ROE)是測試公司如何有效地增加其價值並管理投資者資金的指標。簡而言之,它用於評估公司相對於股本資本的盈利能力。
How To Calculate Return On Equity?
如何計算股東權益報酬率?
ROE can be calculated by using the formula:
淨資產收益率可以使用以下公式進行計算:
Return on Equity = Net Profit (from continuing operations) ÷ Shareholders' Equity
淨資產收益率 = 淨利潤(從持續經營中獲得)÷ 股東權益
So, based on the above formula, the ROE for Humana is:
因此,根據上述公式,哈門那的roe爲:
12% = US$2.0b ÷ US$16b (Based on the trailing twelve months to March 2024).
12%= US$ 2.0b ÷ US$ 16b(基於追蹤十二個月至2024年3月)。
The 'return' refers to a company's earnings over the last year. So, this means that for every $1 of its shareholder's investments, the company generates a profit of $0.12.
“回報”是指公司過去一年的收益。這意味着對於每美元股東的投資,該公司會產生0.12美元的利潤。
What Is The Relationship Between ROE And Earnings Growth?
既然我們已經確定ROE是一種有效的利潤生成標準,用於評估公司未來的盈利能力,我們現在需要評估公司“保留”爲未來增長而重新投資的利潤多少,這使我們對公司的增長潛力有了一個了解。一般而言,在其他條件相等的情況下,ROE和利潤留存高的公司,增長率比沒有這些屬性的公司要高。
Thus far, we have learned that ROE measures how efficiently a company is generating its profits. Based on how much of its profits the company chooses to reinvest or "retain", we are then able to evaluate a company's future ability to generate profits. Generally speaking, other things being equal, firms with a high return on equity and profit retention, have a higher growth rate than firms that don't share these attributes.
到目前爲止,我們已經了解到ROE衡量公司利潤的效率如何。基於公司選擇再投資或保留多少利潤,我們隨後能夠評估公司未來產生利潤的能力。總的來說,在其他條件相等的情況下,具有高ROE和利潤保留的公司的增長率比沒有這些特徵的公司要高。
A Side By Side comparison of Humana's Earnings Growth And 12% ROE
哈門那收入增長和12%roe的並列對比
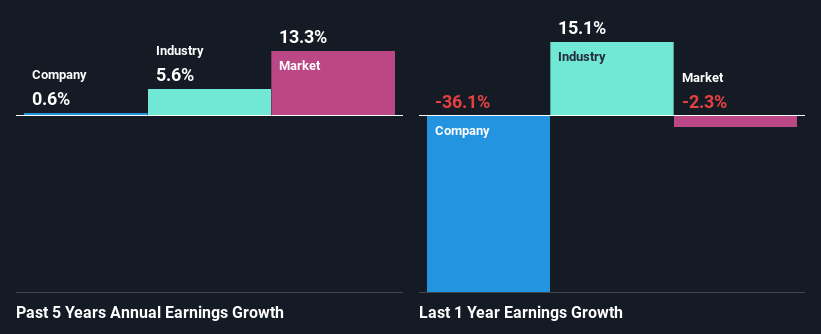
To begin with, Humana seems to have a respectable ROE. And on comparing with the industry, we found that the the average industry ROE is similar at 11%. However, we are curious as to how Humana's decent returns still resulted in flat growth for Humana in the past five years. We reckon that there could be some other factors at play here that's limiting the company's growth. For example, it could be that the company has a high payout ratio or the business has allocated capital poorly, for instance.
首先,哈門那似乎具有受人尊敬的roe。 與行業相比,我們發現平均行業roe爲11%。 然而,我們很好奇爲什麼哈門那的不錯回報仍然導致哈門那在過去五年中增長停滯。 我們認爲這裏可能存在其他因素,限制了公司的增長。例如,公司擁有較高的派息比率或業務資本配置不佳。
Next, on comparing with the industry net income growth, we found that Humana's reported growth was lower than the industry growth of 5.6% over the last few years, which is not something we like to see.
接下來,與行業淨收入增長相比,我們發現哈門那報告的增長低於行業在過去幾年中的增長率爲5.6%,這是我們不喜歡看到的。
The basis for attaching value to a company is, to a great extent, tied to its earnings growth. What investors need to determine next is if the expected earnings growth, or the lack of it, is already built into the share price. This then helps them determine if the stock is placed for a bright or bleak future. One good indicator of expected earnings growth is the P/E ratio which determines the price the market is willing to pay for a stock based on its earnings prospects. So, you may want to check if Humana is trading on a high P/E or a low P/E, relative to its industry.
附加價值的基礎在很大程度上與盈利增長相關。 接下來,投資者需要判斷預期的盈利增長或缺乏盈利增長是否已經反映在股價中。 然後,這有助於他們確定股票是前途光明還是前途暗淡。 預期盈利增長的一個良好指標是市盈率,它根據股票的盈利前景確定市場願意爲股票支付的價格。 因此,您可能需要查看哈門那的市盈率是否高於行業還是低於行業。
Is Humana Efficiently Re-investing Its Profits?
哈門那有效地再投入了其利潤嗎?
Humana has a low three-year median payout ratio of 13% (or a retention ratio of 87%) but the negligible earnings growth number doesn't reflect this as high growth usually follows high profit retention.
哈門那的三年中位數派息比率爲13%(或留存收益率爲87%),但微不足道的盈利增長數字並未反映出高增長,因爲高利潤留存通常會帶來高增長。
In addition, Humana has been paying dividends over a period of at least ten years suggesting that keeping up dividend payments is way more important to the management even if it comes at the cost of business growth. Based on the latest analysts' estimates, we found that the company's future payout ratio over the next three years is expected to hold steady at 15%. Regardless, the future ROE for Humana is predicted to rise to 15% despite there being not much change expected in its payout ratio.
此外,哈門那在至少十年的時間內一直支付股息,這表明即使這是以業務增長爲代價,保持股息支付也比管理層更加重要。 根據最新的分析師估計,我們發現該公司未來三年的派息比率預計將保持穩定在15%。 無論如何,哈門那的未來roe預計將上升至15%,儘管其派息比率預計不會有太大變化。
Conclusion
結論
In total, it does look like Humana has some positive aspects to its business. However, given the high ROE and high profit retention, we would expect the company to be delivering strong earnings growth, but that isn't the case here. This suggests that there might be some external threat to the business, that's hampering its growth. With that said, the latest industry analyst forecasts reveal that the company's earnings are expected to accelerate. To know more about the latest analysts predictions for the company, check out this visualization of analyst forecasts for the company.
總體而言,哈門那的業務具有一些積極方面。 但是,考慮到高roe和高利潤留存,我們希望公司能夠實現強勁的盈利增長,但這在現在不是這種情況。 這表明公司可能存在某些外部威脅,正在妨礙其增長。 話雖如此,最新的行業分析師預測表明,公司的盈利預計將加速增長。 要了解有關該公司的最新分析師預測的更多信息,請查看此分析師預測可視化。
Have feedback on this article? Concerned about the content? Get in touch with us directly. Alternatively, email editorial-team (at) simplywallst.com.
This article by Simply Wall St is general in nature. We provide commentary based on historical data and analyst forecasts only using an unbiased methodology and our articles are not intended to be financial advice. It does not constitute a recommendation to buy or sell any stock, and does not take account of your objectives, or your financial situation. We aim to bring you long-term focused analysis driven by fundamental data. Note that our analysis may not factor in the latest price-sensitive company announcements or qualitative material. Simply Wall St has no position in any stocks mentioned.
對本文有反饋?關於內容有所顧慮?直接和我們聯繫。或者,發送電子郵件至editorial-team (at) simplywallst.com。
這篇文章是Simply Wall St的一般性文章。我們根據歷史數據和分析師預測提供評論,只使用公正的方法論,我們的文章並不意味着提供任何金融建議。文章不構成買賣任何股票的建議,也不考慮您的目標或您的財務狀況。我們的目標是帶給您基本數據驅動的長期關注分析。請注意,我們的分析可能不考慮最新的價格敏感公司公告或定性材料。Simply Wall St沒有任何股票頭寸。
Have feedback on this article? Concerned about the content? Get in touch with us directly. Alternatively, email editorial-team@simplywallst.com
對本文有反饋?關於內容有所顧慮?直接和我們聯繫。或者發送電子郵件至editorial-team@simplywallst.com。
譯文內容由第三人軟體翻譯。