
TTM Technologies (NASDAQ:TTMI) Delivers Shareholders Respectable 15% CAGR Over 5 Years, Surging 3.6% in the Last Week Alone
TTM Technologies (NASDAQ:TTMI) Delivers Shareholders Respectable 15% CAGR Over 5 Years, Surging 3.6% in the Last Week Alone
Generally speaking the aim of active stock picking is to find companies that provide returns that are superior to the market average. Buying under-rated businesses is one path to excess returns. To wit, the TTM Technologies share price has climbed 97% in five years, easily topping the market return of 80% (ignoring dividends). On the other hand, the more recent gains haven't been so impressive, with shareholders gaining just 38%.
一般而言,主動挑選股票的目的是尋找提供高於市場平均水平回報的公司。購買低估的企業是獲得超額回報的一條途徑。照此而行,TTM科技股價在五年內上漲了97%,輕鬆超過市場回報(不包括分紅)的80%。另一方面,近期的漲幅並不那麼令人印象深刻,股東們只賺了38%。
Since the stock has added US$67m to its market cap in the past week alone, let's see if underlying performance has been driving long-term returns.
由於該股票在過去一週內市值增加了6700萬美元,我們來看看其長期收益是否受基本表現的驅動。
To quote Buffett, 'Ships will sail around the world but the Flat Earth Society will flourish. There will continue to be wide discrepancies between price and value in the marketplace...' One flawed but reasonable way to assess how sentiment around a company has changed is to compare the earnings per share (EPS) with the share price.
引用巴菲特的話說,“船隻會在世界各地航行,但是持平地球學會會蓬勃發展。在市場上,價格和價值之間將繼續存在巨大的差距……”評估公司周圍情緒變化的一種有缺陷但合理的方法是將每股收益(EPS)與股價進行比較。
During five years of share price growth, TTM Technologies moved from a loss to profitability. However, it made a loss in the last twelve months, suggesting profit may be an unreliable metric at this stage. So we might find other metrics can better explain the share price movements.
在五年的股價增長中,TTM科技從虧損轉爲盈利。然而,過去12個月中,它出現了虧損,這表明利潤可能是此階段不可靠的度量標準。因此,我們可能會發現其他度量指標可以更好地解釋股價的波動。
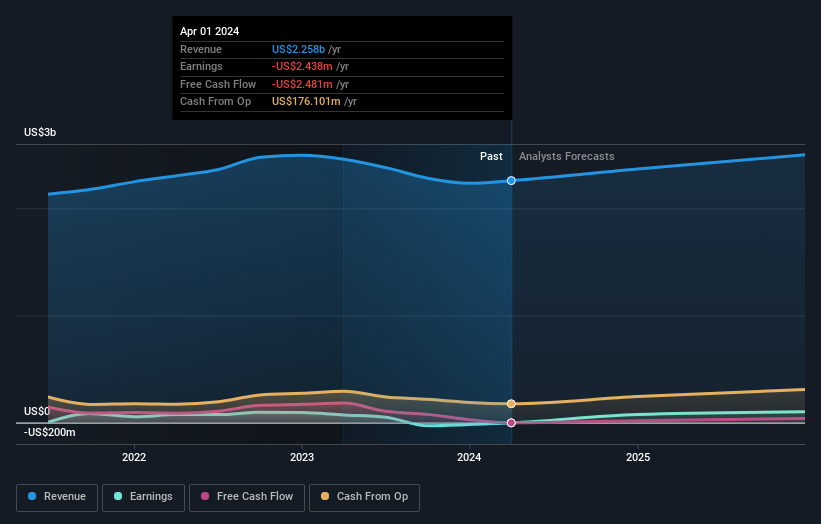
We are not particularly impressed by the annual compound revenue growth of 0.2% over five years. So why is the share price up? It's not immediately obvious to us, but a closer look at the company's progress over time might yield answers.
5年內年複合營業收入增長率僅爲0.2%,我們對此並不特別印象深刻。那麼股價上漲的原因是什麼呢?對我們而言,這並不明顯,但仔細研究一下公司的歷史進展可能會給出答案。
The image below shows how earnings and revenue have tracked over time (if you click on the image you can see greater detail).
下圖顯示了收益和營收隨時間變化的情況(如果你點擊圖像,可以看到更多細節):
It's probably worth noting that the CEO is paid less than the median at similar sized companies. It's always worth keeping an eye on CEO pay, but a more important question is whether the company will grow earnings throughout the years. If you are thinking of buying or selling TTM Technologies stock, you should check out this free report showing analyst profit forecasts.
值得注意的是,CEO的薪酬低於同等規模公司的中位數。關注CEO的薪酬肯定是值得的,但更重要的問題是公司是否會在未來增長盈利。如果您正在考慮買或賣TTM科技的股票,您應該查看這份免費報告,以查看分析師的利潤預測。
A Different Perspective
不同的觀點
It's good to see that TTM Technologies has rewarded shareholders with a total shareholder return of 38% in the last twelve months. That's better than the annualised return of 15% over half a decade, implying that the company is doing better recently. In the best case scenario, this may hint at some real business momentum, implying that now could be a great time to delve deeper. It's always interesting to track share price performance over the longer term. But to understand TTM Technologies better, we need to consider many other factors. Take risks, for example - TTM Technologies has 1 warning sign we think you should be aware of.
很高興看到TTM科技在過去12個月中爲股東提供了38%的總股東回報。這比過去半個世紀的年化回報率15%更好,這意味着公司最近表現更佳。在最理想的情況下,這可能暗示着一些真正的業務動力,這意味着現在可能是深入了解公司的良機。長期跟蹤股價表現總是很有趣的。但要更好地了解TTM科技,我們需要考慮許多其他因素。例如承擔的風險——我們認爲TTM科技有一個警告信號,您應該注意。
If you would prefer to check out another company -- one with potentially superior financials -- then do not miss this free list of companies that have proven they can grow earnings.
如果您願意查看另一家公司-具有潛在更優質財務狀況的公司-則不要錯過這個免費的公司列表,這些公司已經證明他們可以增長收益。
Please note, the market returns quoted in this article reflect the market weighted average returns of stocks that currently trade on American exchanges.
請注意,本文所引述的市場回報反映了目前在美國交易所上市的股票的市場加權平均回報。
Have feedback on this article? Concerned about the content? Get in touch with us directly. Alternatively, email editorial-team (at) simplywallst.com.
This article by Simply Wall St is general in nature. We provide commentary based on historical data and analyst forecasts only using an unbiased methodology and our articles are not intended to be financial advice. It does not constitute a recommendation to buy or sell any stock, and does not take account of your objectives, or your financial situation. We aim to bring you long-term focused analysis driven by fundamental data. Note that our analysis may not factor in the latest price-sensitive company announcements or qualitative material. Simply Wall St has no position in any stocks mentioned.
對本文有反饋?關於內容有所顧慮?直接和我們聯繫。或者,發送電子郵件至editorial-team (at) simplywallst.com。
這篇文章是Simply Wall St的一般性文章。我們根據歷史數據和分析師預測提供評論,只使用公正的方法論,我們的文章並不意味着提供任何金融建議。文章不構成買賣任何股票的建議,也不考慮您的目標或您的財務狀況。我們的目標是帶給您基本數據驅動的長期關注分析。請注意,我們的分析可能不考慮最新的價格敏感公司公告或定性材料。Simply Wall St沒有任何股票頭寸。
Have feedback on this article? Concerned about the content? Get in touch with us directly. Alternatively, email editorial-team@simplywallst.com
對本文有反饋?關於內容有所顧慮?直接和我們聯繫。或者發送電子郵件至editorial-team@simplywallst.com。
譯文內容由第三人軟體翻譯。