
Crane (NYSE:CR) Has A Pretty Healthy Balance Sheet
Crane (NYSE:CR) Has A Pretty Healthy Balance Sheet
David Iben put it well when he said, 'Volatility is not a risk we care about. What we care about is avoiding the permanent loss of capital.' When we think about how risky a company is, we always like to look at its use of debt, since debt overload can lead to ruin. Importantly, Crane Company (NYSE:CR) does carry debt. But is this debt a concern to shareholders?
David Iben說得很好,"波動性並不是我們關心的風險。我們關心的是避免資本的永久損失。" 當我們考慮一個公司的風險程度時,我們總是喜歡看看它的債務使用情況,因爲債務過度負擔可能會導致破產。重要的是,Crane Company(紐交所:CR)確實有債務。但是,這些債務會讓股東擔心嗎?
When Is Debt A Problem?
什麼時候負債才是一個問題?
Debt is a tool to help businesses grow, but if a business is incapable of paying off its lenders, then it exists at their mercy. Part and parcel of capitalism is the process of 'creative destruction' where failed businesses are mercilessly liquidated by their bankers. However, a more frequent (but still costly) occurrence is where a company must issue shares at bargain-basement prices, permanently diluting shareholders, just to shore up its balance sheet. Of course, debt can be an important tool in businesses, particularly capital heavy businesses. When we think about a company's use of debt, we first look at cash and debt together.
債務是幫助企業增長的工具,但是如果企業無力償還債務,它就完全處於貸款方的控制之下。資本主義過程中的一部分是"創造性破壞",失敗的企業被銀行家毫不留情地清算。然而,一種更頻繁(但代價仍然高昂)的情況是公司必須以大幅打折的價格發行股票,永久稀釋股東的利益,只爲了維持其資產負債表。當然,債務在企業中可以是一個重要的工具,特別是在資本密集型企業中。當我們考慮一家公司的債務使用情況時,我們首先看現金和債務。
What Is Crane's Net Debt?
Crane的淨債務是多少?
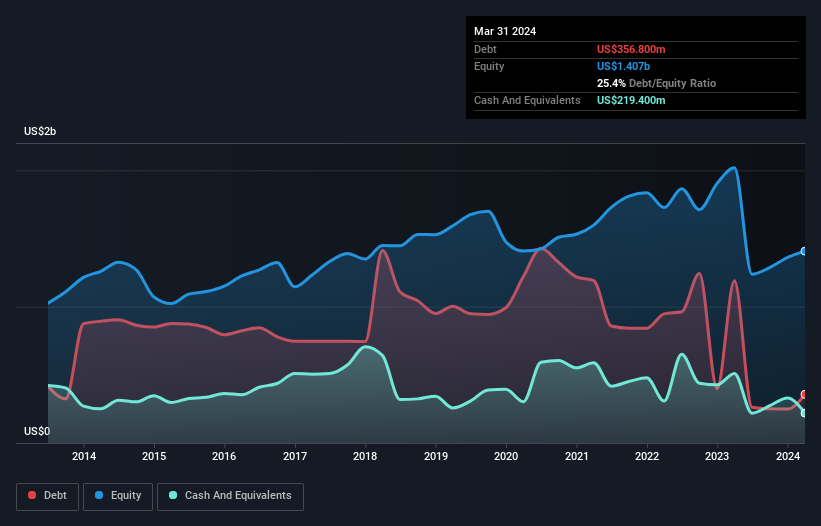
The image below, which you can click on for greater detail, shows that Crane had debt of US$356.8m at the end of March 2024, a reduction from US$1.19b over a year. On the flip side, it has US$219.4m in cash leading to net debt of about US$137.4m.
下面的圖片顯示了,截至2024年3月底,Crane的債務爲3.568億美元,比一年前的11.9億美元有所減少。相反,它有2.194億美元的現金,因此淨債務約爲1.374億美元。
A Look At Crane's Liabilities
看一看Crane的負債情況
The latest balance sheet data shows that Crane had liabilities of US$492.8m due within a year, and liabilities of US$518.6m falling due after that. Offsetting these obligations, it had cash of US$219.4m as well as receivables valued at US$429.7m due within 12 months. So its liabilities outweigh the sum of its cash and (near-term) receivables by US$362.3m.
最新的資產負債表數據顯示,Crane有4.928億美元的短期債務和5.186億美元的到期債務。與這些負債相對應,它有2.194億美元的現金,以及價值4.297億美元的應收賬款,到期在12個月內。因此,其負債超過其現金和(短期)應收賬款的總和達3.623億美元。
Of course, Crane has a market capitalization of US$7.98b, so these liabilities are probably manageable. But there are sufficient liabilities that we would certainly recommend shareholders continue to monitor the balance sheet, going forward.
當然,Crane的市值爲79.8億美元,因此這些負債可能是可以承受的。但是,有足夠的負債,我們肯定建議股東繼續監視資產負債表。
In order to size up a company's debt relative to its earnings, we calculate its net debt divided by its earnings before interest, tax, depreciation, and amortization (EBITDA) and its earnings before interest and tax (EBIT) divided by its interest expense (its interest cover). The advantage of this approach is that we take into account both the absolute quantum of debt (with net debt to EBITDA) and the actual interest expenses associated with that debt (with its interest cover ratio).
爲了考察公司債務與盈利的相對關係,我們計算其淨債務與利息、稅、折舊和攤銷前利潤(EBITDA)的比值以及其利息支出(利息保障倍數)與利潤之前的利潤(EBIT)的比值。這種方法的優點是,我們考慮了與債務相關的絕對量(淨債務與EBITDA)和實際利息開支(利息保障倍數)的實際利潤。
Crane has a low net debt to EBITDA ratio of only 0.38. And its EBIT easily covers its interest expense, being 17.8 times the size. So we're pretty relaxed about its super-conservative use of debt. On top of that, Crane grew its EBIT by 63% over the last twelve months, and that growth will make it easier to handle its debt. The balance sheet is clearly the area to focus on when you are analysing debt. But ultimately the future profitability of the business will decide if Crane can strengthen its balance sheet over time. So if you want to see what the professionals think, you might find this free report on analyst profit forecasts to be interesting.
Crane的淨債務與EBITDA比率爲0.38。它的EBIT很容易覆蓋其利息費用,是利息費用的17.8倍。因此,我們對其超級保守的債務使用感到放心。此外,Crane在過去12個月中增長了63%的EBIT,這種增長將使其更容易處理債務。進行債務分析時,資產負債表顯然是重點。但是,最終業務的未來盈利能力將決定Crane是否能夠隨着時間的推移加強其資產負債表。因此,如果您想了解專業人士的看法,您可能會發現這份免費的分析師利潤預測報告很有趣。
But our final consideration is also important, because a company cannot pay debt with paper profits; it needs cold hard cash. So the logical step is to look at the proportion of that EBIT that is matched by actual free cash flow. In the last three years, Crane's free cash flow amounted to 33% of its EBIT, less than we'd expect. That weak cash conversion makes it more difficult to handle indebtedness.
但是我們最後的考慮也很重要,因爲公司不能靠虛增的利潤來支付債務;它需要現金。因此,邏輯的下一步是查看實際自由現金流匹配的EBIT的比例。在過去三年中,Crane的自由現金流佔其EBIT的比例爲33%,低於我們的預期。這種較弱的現金轉換使其更難處理債務。
Our View
我們的觀點
The good news is that Crane's demonstrated ability to cover its interest expense with its EBIT delights us like a fluffy puppy does a toddler. But, on a more sombre note, we are a little concerned by its conversion of EBIT to free cash flow. Looking at the bigger picture, we think Crane's use of debt seems quite reasonable and we're not concerned about it. While debt does bring risk, when used wisely it can also bring a higher return on equity. We'd be motivated to research the stock further if we found out that Crane insiders have bought shares recently. If you would too, then you're in luck, since today we're sharing our list of reported insider transactions for free.
好消息是,Crane用其EBIT覆蓋其利息費用的能力令我們像嬰兒喜歡毛茸茸的小狗一樣高興。但是,更嚴肅的問題是,我們對其將EBIT轉換爲自由現金流的能力有些擔憂。從大局來看,我們認爲Crane的債務使用似乎相當合理,我們對此不擔心。雖然債務確實帶來風險,但明智利用時也能帶來更高的股本回報率。如果我們發現Crane的內部人士最近購買了股票,我們將被激發研究該股票的更多信息。如果您也是,則有福了,因爲今天我們免費分享了報告的內部交易列表。
If you're interested in investing in businesses that can grow profits without the burden of debt, then check out this free list of growing businesses that have net cash on the balance sheet.
如果您有興趣投資能夠在不負債的情況下增長利潤的企業,請查看這份免費列表,其中列出了在資產負債表上擁有淨現金的成長型企業。
Have feedback on this article? Concerned about the content? Get in touch with us directly. Alternatively, email editorial-team (at) simplywallst.com.
This article by Simply Wall St is general in nature. We provide commentary based on historical data and analyst forecasts only using an unbiased methodology and our articles are not intended to be financial advice. It does not constitute a recommendation to buy or sell any stock, and does not take account of your objectives, or your financial situation. We aim to bring you long-term focused analysis driven by fundamental data. Note that our analysis may not factor in the latest price-sensitive company announcements or qualitative material. Simply Wall St has no position in any stocks mentioned.
對本文有反饋?關於內容有所顧慮?直接和我們聯繫。或者,發送電子郵件至editorial-team (at) simplywallst.com。
這篇文章是Simply Wall St的一般性文章。我們根據歷史數據和分析師預測提供評論,只使用公正的方法論,我們的文章並不意味着提供任何金融建議。文章不構成買賣任何股票的建議,也不考慮您的目標或您的財務狀況。我們的目標是帶給您基本數據驅動的長期關注分析。請注意,我們的分析可能不考慮最新的價格敏感公司公告或定性材料。Simply Wall St沒有任何股票頭寸。
Have feedback on this article? Concerned about the content? Get in touch with us directly. Alternatively, email editorial-team@simplywallst.com
對本文有反饋?關於內容有所顧慮?直接和我們聯繫。或者發送電子郵件至editorial-team@simplywallst.com。
譯文內容由第三人軟體翻譯。