
Global-E Online Ltd.'s (NASDAQ:GLBE) Intrinsic Value Is Potentially 79% Above Its Share Price
Global-E Online Ltd.'s (NASDAQ:GLBE) Intrinsic Value Is Potentially 79% Above Its Share Price
Key Insights
主要見解
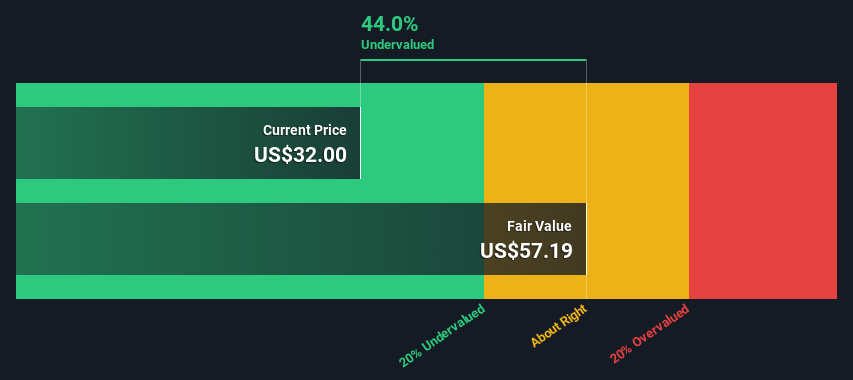
- Using the 2 Stage Free Cash Flow to Equity, Global-E Online fair value estimate is US$57.19
- Global-E Online's US$32.00 share price signals that it might be 44% undervalued
- Analyst price target for GLBE is US$43.33 which is 24% below our fair value estimate
- 使用兩階段自由現金流量賦值法,Global-E Online 的公允價值爲57.19美元。
- Global-E Online 的32.00美元股價表明其可能被低估了44%。
- 分析師對 GLBE 的目標價爲43.33美元,比我們的公允價值估計低24%。
In this article we are going to estimate the intrinsic value of Global-E Online Ltd. (NASDAQ:GLBE) by taking the expected future cash flows and discounting them to their present value. The Discounted Cash Flow (DCF) model is the tool we will apply to do this. Believe it or not, it's not too difficult to follow, as you'll see from our example!
在這篇文章中,我們將通過預期未來現金流並將其貼現到其現值來估算 Global-E Online Ltd.(納斯達克:GLBE)的內在價值。我們將應用折現現金流模型(DCF)來做這個工具。不管你信不信,這並不難跟隨,就像你從我們的例子中看到的一樣!
We would caution that there are many ways of valuing a company and, like the DCF, each technique has advantages and disadvantages in certain scenarios. Anyone interested in learning a bit more about intrinsic value should have a read of the Simply Wall St analysis model.
我們要提醒的是,估值公司有很多方法,像DCF一樣,每種技術在某些情況下都有優點和缺點。有興趣了解內在價值的人應該讀一下Simply Wall St的分析模型。
The Calculation
計算方法
We're using the 2-stage growth model, which simply means we take in account two stages of company's growth. In the initial period the company may have a higher growth rate and the second stage is usually assumed to have a stable growth rate. To begin with, we have to get estimates of the next ten years of cash flows. Where possible we use analyst estimates, but when these aren't available we extrapolate the previous free cash flow (FCF) from the last estimate or reported value. We assume companies with shrinking free cash flow will slow their rate of shrinkage, and that companies with growing free cash flow will see their growth rate slow, over this period. We do this to reflect that growth tends to slow more in the early years than it does in later years.
我們使用2階段成長模型,這意味着我們考慮公司的兩個成長階段。在初始階段,該公司的增長率可能較高,而第二階段通常假定具有穩定的增長率。首先,我們必須獲得未來10年現金流的估計。在可能的情況下,我們使用分析師的估計,但在沒有可用估計時,我們會將以前的自由現金流(FCF)從最後一個估計或報告的價值中推導出來。我們假設自由現金流縮減的公司將減緩他們的縮減速度,並且自由現金流增長的公司在此期間將看到其增長率放緩。我們這樣做是爲了反映增長在早期年份的減速比晚期年份更加明顯。
Generally we assume that a dollar today is more valuable than a dollar in the future, so we discount the value of these future cash flows to their estimated value in today's dollars:
通常我們認爲今天的一美元比未來的一美元更有價值,因此我們將這些未來的現金流折現爲今天的估計價值:
10-year free cash flow (FCF) forecast
10年自由現金流(FCF)預測
| 2024 | 2025 | 2026 | 2027 | 2028 | 2029 | 2030 | 2031 | 2032 | 2033 | |
| Levered FCF ($, Millions) | US$130.2m | US$185.2m | US$297.9m | US$389.6m | US$476.4m | US$554.0m | US$621.1m | US$678.3m | US$726.8m | US$768.4m |
| Growth Rate Estimate Source | Analyst x3 | Analyst x3 | Analyst x1 | Est @ 30.78% | Est @ 22.26% | Est @ 16.29% | Est @ 12.12% | Est @ 9.20% | Est @ 7.15% | Est @ 5.72% |
| Present Value ($, Millions) Discounted @ 7.9% | US$121 | US$159 | US$237 | US$287 | US$325 | US$351 | US$364 | US$368 | US$366 | US$358 |
| 2024 | 2025 | 2026 | 2027 | 2028 | 2029 | 2030 | 2031 | 2032 | 2033 | |
| 槓桿自由現金流 ($, 百萬) | 1.302億美元 | 1.852億美元 | 2.979億美元 | 3.896億美元 | 4.764億美元 | 5.540億美元 | 6.211億美元 | 6.783億美元 | 7.268億美元 | 7.684億美元 |
| 創業板增長率預測來源 | 分析師x3 | 分析師x3 | 分析師x1 | 以30.78%估算的價值 | 以22.26%估算的價值 | 以16.29%估算的價值 | 以12.12%估算的價值 | 以9.20%估算的價值 | 以7.15%估算的價值 | 估計爲5.72% |
| 現值($,百萬)折現率爲7.9% | 121美元 | 159美元 | 237美元 | 287美元 | 325美元 | 351美元 | 364美元 | 美元368 | 366美元 | 358美元 |
("Est" = FCF growth rate estimated by Simply Wall St)
Present Value of 10-year Cash Flow (PVCF) = US$2.9b
("Est" = FCF增長率估計由Simply Wall St)
十年現金流的現值(PVCF)= 29億美元
The second stage is also known as Terminal Value, this is the business's cash flow after the first stage. For a number of reasons a very conservative growth rate is used that cannot exceed that of a country's GDP growth. In this case we have used the 5-year average of the 10-year government bond yield (2.4%) to estimate future growth. In the same way as with the 10-year 'growth' period, we discount future cash flows to today's value, using a cost of equity of 7.9%.
第二階段也稱爲終端價值,指企業在第一階段之後的現金流量。出於多種原因,使用的增長率非常保守,不能超過國家GDP增長率。在這種情況下,我們使用了10年期政府債券收益率的5年平均值(2.4%)來估計未來增長。與10年“增長”期相同,將未來現金流折現爲今天的價值,使用的權益成本爲7.9%。
Terminal Value (TV)= FCF2033 × (1 + g) ÷ (r – g) = US$768m× (1 + 2.4%) ÷ (7.9%– 2.4%) = US$14b
終止價值(TV)= FCF2033×(1 + g)÷(r-g)=US $768m*(1 + 2.4%)÷(7.9% - 2.4%)=US $14b
Present Value of Terminal Value (PVTV)= TV / (1 + r)10= US$14b÷ ( 1 + 7.9%)10= US$6.6b
終止價值現值(PVTV)= TV / (1 + r)10= US $ 14b÷(1 + 7.9%)10= 66億美元
The total value is the sum of cash flows for the next ten years plus the discounted terminal value, which results in the Total Equity Value, which in this case is US$9.6b. To get the intrinsic value per share, we divide this by the total number of shares outstanding. Relative to the current share price of US$32.0, the company appears quite undervalued at a 44% discount to where the stock price trades currently. Valuations are imprecise instruments though, rather like a telescope - move a few degrees and end up in a different galaxy. Do keep this in mind.
總價值爲未來十年現金流量的總和加上折現終端價值,這其中的股權總價值爲96億美元。爲得到每股內在價值,我們將其除以總股份數。與目前的股票價格32.0美元相比,該公司的價值顯示出較高的低估,折扣率爲44%。但是,估值不是精確的儀器,就像望遠鏡一樣-稍微移動幾度,就會進入不同的星系。請記住這一點。
Important Assumptions
重要假設
We would point out that the most important inputs to a discounted cash flow are the discount rate and of course the actual cash flows. Part of investing is coming up with your own evaluation of a company's future performance, so try the calculation yourself and check your own assumptions. The DCF also does not consider the possible cyclicality of an industry, or a company's future capital requirements, so it does not give a full picture of a company's potential performance. Given that we are looking at Global-E Online as potential shareholders, the cost of equity is used as the discount rate, rather than the cost of capital (or weighted average cost of capital, WACC) which accounts for debt. In this calculation we've used 7.9%, which is based on a levered beta of 0.985. Beta is a measure of a stock's volatility, compared to the market as a whole. We get our beta from the industry average beta of globally comparable companies, with an imposed limit between 0.8 and 2.0, which is a reasonable range for a stable business.
折現現金流量的最重要的參數是折現率和實際現金流量。投資的一部分在於對公司未來表現的自我評估,因此可以自行進行計算並覈對自己的假設。DCF模型還不考慮產業可能的週期性或公司未來的資本需求,因此不能完全顯示公司的潛力。鑑於我們正在關注Global-E Online作爲潛在的股東,因此將使用權益成本作爲折現率,而不是考慮債務的資本成本(或加權平均資本成本,WACC)。在這種計算中,我們使用了7.9%,這是基於槓桿貝塔爲0.985的動態貝塔得到的。貝塔是衡量股票相對於整個市場波動性的指標。我們的貝塔來自全球可比公司的行業平均貝塔,限制範圍在0.8至2.0之間,這是穩定業務的合理範圍。
Moving On:
接下來:
Valuation is only one side of the coin in terms of building your investment thesis, and it ideally won't be the sole piece of analysis you scrutinize for a company. DCF models are not the be-all and end-all of investment valuation. Preferably you'd apply different cases and assumptions and see how they would impact the company's valuation. If a company grows at a different rate, or if its cost of equity or risk free rate changes sharply, the output can look very different. Can we work out why the company is trading at a discount to intrinsic value? For Global-E Online, we've put together three pertinent items you should look at:
價值評估只是構建您的投資論點的一面,理想情況下,不會是您詳細分析公司的唯一課程。DCF模型不是投資估值的全部,最好應用不同的案例和假設,並查看它們對公司估值的影響。如果公司以不同的速度增長,或者其權益成本或無風險利率發生劇烈變化,那麼結果可能會截然不同。我們能否找出公司爲什麼以低於內在價值的價格交易?對於Global-E Online,我們提供了三個有關您應該關注的重要事項:
- Financial Health: Does GLBE have a healthy balance sheet? Take a look at our free balance sheet analysis with six simple checks on key factors like leverage and risk.
- Future Earnings: How does GLBE's growth rate compare to its peers and the wider market? Dig deeper into the analyst consensus number for the upcoming years by interacting with our free analyst growth expectation chart.
- Other Solid Businesses: Low debt, high returns on equity and good past performance are fundamental to a strong business. Why not explore our interactive list of stocks with solid business fundamentals to see if there are other companies you may not have considered!
- 財務狀況:GLBE是否具有健康的資產負債表?查看我們的六個關鍵因素的自由資產負債表分析。
- 未來盈利:GLBE的增長率與其同行和更廣泛的市場相比如何?通過與我們的免費分析師增長期望圖表進行交互,深入了解未來幾年的分析師共識數字。
- 其他優秀企業:低負債,高股本回報率和良好的過去業績是構建強大企業基礎的基礎。爲什麼不探索我們交互式的股票列表,其中包括具有堅實業務基礎的其他公司?
PS. The Simply Wall St app conducts a discounted cash flow valuation for every stock on the NASDAQGS every day. If you want to find the calculation for other stocks just search here.
PS。Simply Wall St 應用程序每天針對納斯達克股票市場上的每隻股票進行現金流折現估值。如果您想找到其他股票的計算,請在此處搜索。
Have feedback on this article? Concerned about the content? Get in touch with us directly. Alternatively, email editorial-team (at) simplywallst.com.
This article by Simply Wall St is general in nature. We provide commentary based on historical data and analyst forecasts only using an unbiased methodology and our articles are not intended to be financial advice. It does not constitute a recommendation to buy or sell any stock, and does not take account of your objectives, or your financial situation. We aim to bring you long-term focused analysis driven by fundamental data. Note that our analysis may not factor in the latest price-sensitive company announcements or qualitative material. Simply Wall St has no position in any stocks mentioned.
對本文有反饋?關於內容有所顧慮?直接和我們聯繫。或者,發送電子郵件至editorial-team (at) simplywallst.com。
這篇文章是Simply Wall St的一般性文章。我們根據歷史數據和分析師預測提供評論,只使用公正的方法論,我們的文章並不意味着提供任何金融建議。文章不構成買賣任何股票的建議,也不考慮您的目標或您的財務狀況。我們的目標是帶給您基本數據驅動的長期關注分析。請注意,我們的分析可能不考慮最新的價格敏感公司公告或定性材料。Simply Wall St沒有任何股票頭寸。
Have feedback on this article? Concerned about the content? Get in touch with us directly. Alternatively, email editorial-team@simplywallst.com
對本文有反饋?關於內容有所顧慮?直接和我們聯繫。或者發送電子郵件至editorial-team@simplywallst.com。
譯文內容由第三人軟體翻譯。