
Investors in Amphastar Pharmaceuticals (NASDAQ:AMPH) Have Seen Impressive Returns of 101% Over the Past Three Years
Investors in Amphastar Pharmaceuticals (NASDAQ:AMPH) Have Seen Impressive Returns of 101% Over the Past Three Years
It might seem bad, but the worst that can happen when you buy a stock (without leverage) is that its share price goes to zero. But in contrast you can make much more than 100% if the company does well. To wit, the Amphastar Pharmaceuticals, Inc. (NASDAQ:AMPH) share price has flown 101% in the last three years. How nice for those who held the stock! It's down 2.8% in the last seven days.
買入股票(不帶槓桿)的最壞結果是股價降至0,但相比之下如果公司業績好,你可以獲得遠高於100%的收益。例如,enlink midstream股票價格比三年前高出117%。這樣的回報是堅如磐石的。上週,股價上漲了1.3%。比如果公司表現良好,將獲得不少於100%的回報。例如,過去三年裏,Amphastar製藥公司(NASDAQ:AMPH)的股價上漲了101%。持有該股票的人很慶幸!但過去七天該股價下跌了2.8%。
Let's take a look at the underlying fundamentals over the longer term, and see if they've been consistent with shareholders returns.
讓我們長期看一下潛在的基本面,看看它們是否與股東回報一致。
To paraphrase Benjamin Graham: Over the short term the market is a voting machine, but over the long term it's a weighing machine. One way to examine how market sentiment has changed over time is to look at the interaction between a company's share price and its earnings per share (EPS).
用本傑明·格雷厄姆的話來說:“短期市場是一臺投票機,但長期市場是一臺稱重機”。檢查市場情緒如何隨時間推移變化的一種方式是查看公司股價和每股收益(EPS)之間的相互作用。
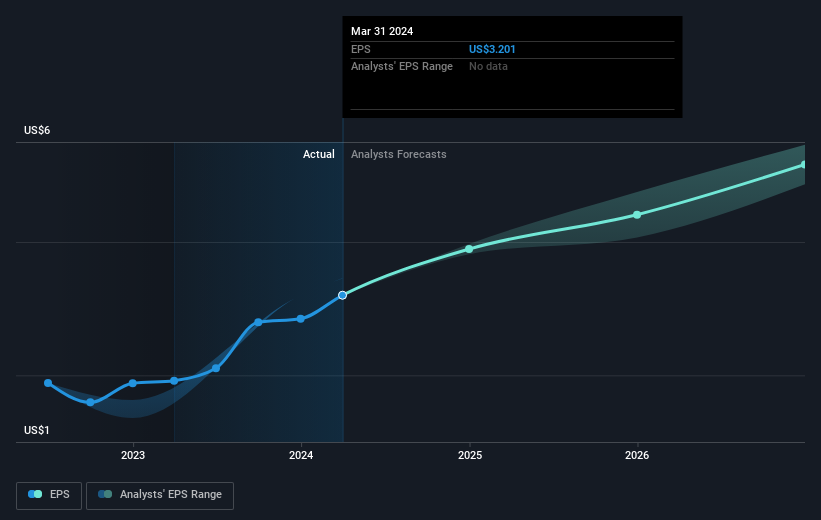
Amphastar Pharmaceuticals was able to grow its EPS at 291% per year over three years, sending the share price higher. This EPS growth is higher than the 26% average annual increase in the share price. So it seems investors have become more cautious about the company, over time.
過去三年,Amphastar製藥公司每股收益增長了291%,推動股價走高。這種每股收益增長高於股價的平均年增長率26%。所以,隨着時間的推移,投資者對該公司變得更加謹慎。
You can see below how EPS has changed over time (discover the exact values by clicking on the image).
下面可以看到每股收益隨時間的變化情況(通過點擊圖像來查看確切數值)。
It is of course excellent to see how Amphastar Pharmaceuticals has grown profits over the years, but the future is more important for shareholders. You can see how its balance sheet has strengthened (or weakened) over time in this free interactive graphic.
看到Amphastar製藥公司這些年來的盈利增長當然很棒,但對於股東們來說,未來更爲重要。通過這個免費的互動圖表,可以看到該公司的資產負債表是如何隨時間變化的。
A Different Perspective
不同的觀點
Amphastar Pharmaceuticals shareholders are down 26% for the year, but the market itself is up 23%. However, keep in mind that even the best stocks will sometimes underperform the market over a twelve month period. On the bright side, long term shareholders have made money, with a gain of 15% per year over half a decade. If the fundamental data continues to indicate long term sustainable growth, the current sell-off could be an opportunity worth considering. While it is well worth considering the different impacts that market conditions can have on the share price, there are other factors that are even more important. Even so, be aware that Amphastar Pharmaceuticals is showing 1 warning sign in our investment analysis , you should know about...
Amphastar製藥公司的股東在今年虧損了26%,但市場自身卻上漲了23%。然而,需要注意的是,即使是最好的股票有時也會在12個月的時期內跑輸市場。但從積極的角度看,長期的股東們卻獲得了收益,過去五年每年增長了15%。如果基礎數據繼續表明可以實現長期可持續增長,當前的拋售可能值得考慮。儘管考慮市場狀況對股價的不同影響是非常值得的,但更重要的是,還有其他因素需要考慮。然而,需要注意的是,Amphastar製藥公司在我們的投資分析中顯示出一個警告信號,你需要知道......
But note: Amphastar Pharmaceuticals may not be the best stock to buy. So take a peek at this free list of interesting companies with past earnings growth (and further growth forecast).
需要注意的是:Amphastar製藥公司可能並不是最佳投資股票。因此,請查看此免費清單,其中包含過去盈利增長(以及進一步增長預測)的有趣公司。
Please note, the market returns quoted in this article reflect the market weighted average returns of stocks that currently trade on American exchanges.
請注意,本文所引述的市場回報反映了目前在美國交易所上市的股票的市場加權平均回報。
Have feedback on this article? Concerned about the content? Get in touch with us directly. Alternatively, email editorial-team (at) simplywallst.com.
This article by Simply Wall St is general in nature. We provide commentary based on historical data and analyst forecasts only using an unbiased methodology and our articles are not intended to be financial advice. It does not constitute a recommendation to buy or sell any stock, and does not take account of your objectives, or your financial situation. We aim to bring you long-term focused analysis driven by fundamental data. Note that our analysis may not factor in the latest price-sensitive company announcements or qualitative material. Simply Wall St has no position in any stocks mentioned.
對本文有反饋?關於內容有所顧慮?直接和我們聯繫。或者,發送電子郵件至editorial-team (at) simplywallst.com。
這篇文章是Simply Wall St的一般性文章。我們根據歷史數據和分析師預測提供評論,只使用公正的方法論,我們的文章並不意味着提供任何金融建議。文章不構成買賣任何股票的建議,也不考慮您的目標或您的財務狀況。我們的目標是帶給您基本數據驅動的長期關注分析。請注意,我們的分析可能不考慮最新的價格敏感公司公告或定性材料。Simply Wall St沒有任何股票頭寸。
Have feedback on this article? Concerned about the content? Get in touch with us directly. Alternatively, email editorial-team@simplywallst.com
對本文有反饋?關於內容有所顧慮?直接和我們聯繫。或者發送電子郵件至editorial-team@simplywallst.com。
譯文內容由第三人軟體翻譯。