
The 7.2% Return This Week Takes Veeco Instruments' (NASDAQ:VECO) Shareholders Five-year Gains to 308%
The 7.2% Return This Week Takes Veeco Instruments' (NASDAQ:VECO) Shareholders Five-year Gains to 308%
We think all investors should try to buy and hold high quality multi-year winners. And highest quality companies can see their share prices grow by huge amounts. Just think about the savvy investors who held Veeco Instruments Inc. (NASDAQ:VECO) shares for the last five years, while they gained 308%. This just goes to show the value creation that some businesses can achieve. On top of that, the share price is up 36% in about a quarter.
我們認爲所有的投資者都應該嘗試購買和持有高品質的多年贏家。而最高品質的公司的股價可以增長很多。想想那些持有維易科精密儀器股票(納斯達克:VECO)五年時間的精明投資者,他們的股票升值了308%。這只是表明一些企業可以創造市值的價值。除此之外,股價在不到一個季度內上漲了36%。
Since the stock has added US$173m to its market cap in the past week alone, let's see if underlying performance has been driving long-term returns.
由於該股票在過去一個星期內增加了1.73億美元的市值,讓我們看看是否潛在的績效驅動了長期回報。
While the efficient markets hypothesis continues to be taught by some, it has been proven that markets are over-reactive dynamic systems, and investors are not always rational. One imperfect but simple way to consider how the market perception of a company has shifted is to compare the change in the earnings per share (EPS) with the share price movement.
雖然一些人仍然相信有效市場假說,但已經證明市場是過度反應的動態系統,投資者並不總是理性的。一個不完美但簡單的方法來考慮公司市場看法的變化是比較每股收益(EPS)的變化和股價的波動。
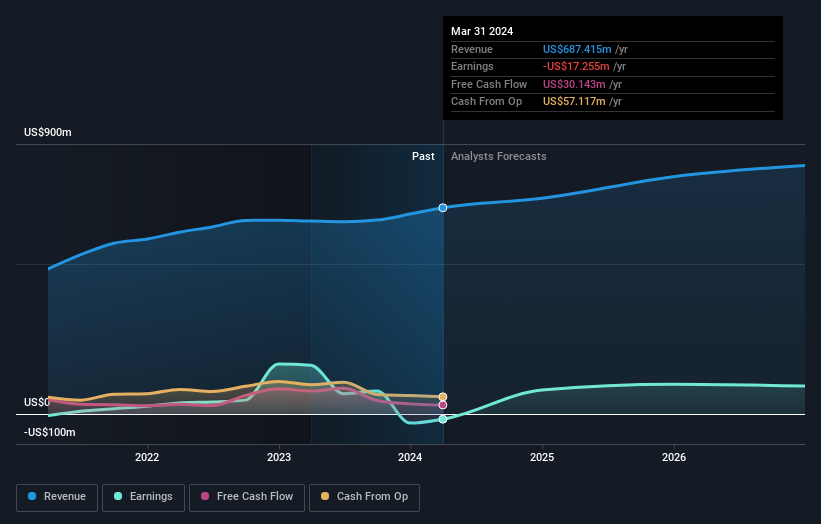
Veeco Instruments became profitable within the last five years. However, it made a loss in the last twelve months, suggesting profit may be an unreliable metric at this stage. So we might find other metrics can better explain the share price movements.
維易科精密儀器在過去五年內實現了盈利。然而,在過去十二個月中它卻虧損了,這表明盈利可能是不可靠的。因此,我們可能會發現其他指標能更好地解釋股價波動。
On the other hand, Veeco Instruments' revenue is growing nicely, at a compound rate of 11% over the last five years. It's quite possible that management are prioritizing revenue growth over EPS growth at the moment.
另一方面,維易科精密儀器的營業收入增長不錯,過去五年複合增長率爲11%。目前管理層可能更加重視營收增長而不是每股收益增長。
The image below shows how earnings and revenue have tracked over time (if you click on the image you can see greater detail).
下圖顯示了收益和營收隨時間變化的情況(如果你點擊圖像,可以看到更多細節):
Balance sheet strength is crucial. It might be well worthwhile taking a look at our free report on how its financial position has changed over time.
資產負債表強度至關重要。查看我們關於其財務狀況如何隨時間變化的免費報告可能很值得一看。
A Different Perspective
不同的觀點
We're pleased to report that Veeco Instruments shareholders have received a total shareholder return of 85% over one year. That's better than the annualised return of 32% over half a decade, implying that the company is doing better recently. In the best case scenario, this may hint at some real business momentum, implying that now could be a great time to delve deeper. It's always interesting to track share price performance over the longer term. But to understand Veeco Instruments better, we need to consider many other factors. For instance, we've identified 2 warning signs for Veeco Instruments that you should be aware of.
我們很高興地宣佈,維易科精密儀器的股東在一年內獲得了85%的總股東回報。這比過去五年32%的年化回報率更好,這意味着公司最近做得更好。在最好的情況下,這可能暗示着一些實際的業務動力,這可能意味着現在是深入研究的好時機。長期跟蹤股價表現總是很有趣的。但要更好地了解維易科精密儀器,我們需要考慮許多其他因素。例如,我們已經發現了2個維易科精密儀器的警示信號,你們應該意識到。
Of course Veeco Instruments may not be the best stock to buy. So you may wish to see this free collection of growth stocks.
當然,維易科精密儀器可能不是最好的股票去購買。因此,您可能希望查看這些免費的成長股票收藏。
Please note, the market returns quoted in this article reflect the market weighted average returns of stocks that currently trade on American exchanges.
請注意,本文所引述的市場回報反映了目前在美國交易所上市的股票的市場加權平均回報。
Have feedback on this article? Concerned about the content? Get in touch with us directly. Alternatively, email editorial-team (at) simplywallst.com.
This article by Simply Wall St is general in nature. We provide commentary based on historical data and analyst forecasts only using an unbiased methodology and our articles are not intended to be financial advice. It does not constitute a recommendation to buy or sell any stock, and does not take account of your objectives, or your financial situation. We aim to bring you long-term focused analysis driven by fundamental data. Note that our analysis may not factor in the latest price-sensitive company announcements or qualitative material. Simply Wall St has no position in any stocks mentioned.
對本文有反饋?關於內容有所顧慮?直接和我們聯繫。或者,發送電子郵件至editorial-team (at) simplywallst.com。
這篇文章是Simply Wall St的一般性文章。我們根據歷史數據和分析師預測提供評論,只使用公正的方法論,我們的文章並不意味着提供任何金融建議。文章不構成買賣任何股票的建議,也不考慮您的目標或您的財務狀況。我們的目標是帶給您基本數據驅動的長期關注分析。請注意,我們的分析可能不考慮最新的價格敏感公司公告或定性材料。Simply Wall St沒有任何股票頭寸。
Have feedback on this article? Concerned about the content? Get in touch with us directly. Alternatively, email editorial-team@simplywallst.com
對本文有反饋?關於內容有所顧慮?直接和我們聯繫。或者發送電子郵件至editorial-team@simplywallst.com。
譯文內容由第三人軟體翻譯。