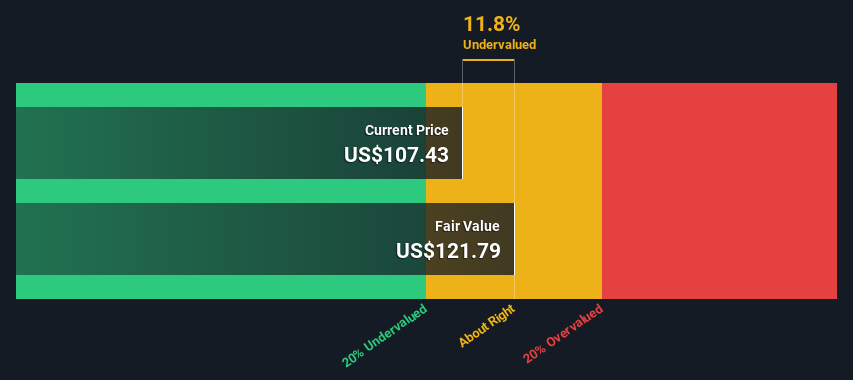
TKO Group Holdings' estimated fair value is US$122 based on 2 Stage Free Cash Flow to Equity
With US$107 share price, TKO Group Holdings appears to be trading close to its estimated fair value
The US$117 analyst price target for TKO is 4.1% less than our estimate of fair value
Today we'll do a simple run through of a valuation method used to estimate the attractiveness of TKO Group Holdings, Inc. (NYSE:TKO) as an investment opportunity by taking the expected future cash flows and discounting them to today's value. The Discounted Cash Flow (DCF) model is the tool we will apply to do this. Don't get put off by the jargon, the math behind it is actually quite straightforward.
Remember though, that there are many ways to estimate a company's value, and a DCF is just one method. If you want to learn more about discounted cash flow, the rationale behind this calculation can be read in detail in the Simply Wall St analysis model.
Is TKO Group Holdings Fairly Valued?
We are going to use a two-stage DCF model, which, as the name states, takes into account two stages of growth. The first stage is generally a higher growth period which levels off heading towards the terminal value, captured in the second 'steady growth' period. In the first stage we need to estimate the cash flows to the business over the next ten years. Where possible we use analyst estimates, but when these aren't available we extrapolate the previous free cash flow (FCF) from the last estimate or reported value. We assume companies with shrinking free cash flow will slow their rate of shrinkage, and that companies with growing free cash flow will see their growth rate slow, over this period. We do this to reflect that growth tends to slow more in the early years than it does in later years.
A DCF is all about the idea that a dollar in the future is less valuable than a dollar today, so we discount the value of these future cash flows to their estimated value in today's dollars:
10-year free cash flow (FCF) estimate
2024
2025
2026
2027
2028
2029
2030
2031
2032
2033
Levered FCF ($, Millions)
US$595.0m
US$908.1m
US$1.16b
US$1.21b
US$1.25b
US$1.28b
US$1.32b
US$1.35b
US$1.39b
US$1.42b
Growth Rate Estimate Source
Analyst x6
Analyst x6
Analyst x3
Analyst x1
Est @ 3.11%
Est @ 2.89%
Est @ 2.74%
Est @ 2.63%
Est @ 2.56%
Est @ 2.50%
Present Value ($, Millions) Discounted @ 7.7%
US$552
US$783
US$932
US$898
US$860
US$821
US$783
US$746
US$711
US$676
("Est" = FCF growth rate estimated by Simply Wall St) Present Value of 10-year Cash Flow (PVCF) = US$7.8b
The second stage is also known as Terminal Value, this is the business's cash flow after the first stage. The Gordon Growth formula is used to calculate Terminal Value at a future annual growth rate equal to the 5-year average of the 10-year government bond yield of 2.4%. We discount the terminal cash flows to today's value at a cost of equity of 7.7%.
Present Value of Terminal Value (PVTV)= TV / (1 + r)10= US$27b÷ ( 1 + 7.7%)10= US$13b
The total value is the sum of cash flows for the next ten years plus the discounted terminal value, which results in the Total Equity Value, which in this case is US$21b. The last step is to then divide the equity value by the number of shares outstanding. Relative to the current share price of US$107, the company appears about fair value at a 12% discount to where the stock price trades currently. The assumptions in any calculation have a big impact on the valuation, so it is better to view this as a rough estimate, not precise down to the last cent.
NYSE:TKO Discounted Cash Flow June 14th 2024
The Assumptions
Now the most important inputs to a discounted cash flow are the discount rate, and of course, the actual cash flows. You don't have to agree with these inputs, I recommend redoing the calculations yourself and playing with them. The DCF also does not consider the possible cyclicality of an industry, or a company's future capital requirements, so it does not give a full picture of a company's potential performance. Given that we are looking at TKO Group Holdings as potential shareholders, the cost of equity is used as the discount rate, rather than the cost of capital (or weighted average cost of capital, WACC) which accounts for debt. In this calculation we've used 7.7%, which is based on a levered beta of 1.160. Beta is a measure of a stock's volatility, compared to the market as a whole. We get our beta from the industry average beta of globally comparable companies, with an imposed limit between 0.8 and 2.0, which is a reasonable range for a stable business.
SWOT Analysis for TKO Group Holdings
Strength
Net debt to equity ratio below 40%.
Balance sheet summary for TKO.
Weakness
Interest payments on debt are not well covered.
Opportunity
Expected to breakeven next year.
Has sufficient cash runway for more than 3 years based on current free cash flows.
Good value based on P/S ratio and estimated fair value.
Threat
Debt is not well covered by operating cash flow.
Is TKO well equipped to handle threats?
Next Steps:
Valuation is only one side of the coin in terms of building your investment thesis, and it shouldn't be the only metric you look at when researching a company. The DCF model is not a perfect stock valuation tool. Preferably you'd apply different cases and assumptions and see how they would impact the company's valuation. For example, changes in the company's cost of equity or the risk free rate can significantly impact the valuation. For TKO Group Holdings, we've compiled three additional elements you should further examine:
Risks: Every company has them, and we've spotted 1 warning sign for TKO Group Holdings you should know about.
Future Earnings: How does TKO's growth rate compare to its peers and the wider market? Dig deeper into the analyst consensus number for the upcoming years by interacting with our free analyst growth expectation chart.
Other Solid Businesses: Low debt, high returns on equity and good past performance are fundamental to a strong business. Why not explore our interactive list of stocks with solid business fundamentals to see if there are other companies you may not have considered!
PS. Simply Wall St updates its DCF calculation for every American stock every day, so if you want to find the intrinsic value of any other stock just search here.
Have feedback on this article? Concerned about the content?Get in touch with us directly. Alternatively, email editorial-team (at) simplywallst.com. This article by Simply Wall St is general in nature. We provide commentary based on historical data and analyst forecasts only using an unbiased methodology and our articles are not intended to be financial advice. It does not constitute a recommendation to buy or sell any stock, and does not take account of your objectives, or your financial situation. We aim to bring you long-term focused analysis driven by fundamental data. Note that our analysis may not factor in the latest price-sensitive company announcements or qualitative material. Simply Wall St has no position in any stocks mentioned.
Have feedback on this article? Concerned about the content? Get in touch with us directly. Alternatively, email editorial-team@simplywallst.com
主要見解
基於二階自由現金流到股權的估值,TKO Group Holdings的預估公允價值爲122美元
以107美元的股價,TKO Group Holdings似乎正在接近其預測公允價值
對於TKO來說,分析師的117美元的價格目標比我們的公允價值估計少了4.1%
今天我們將通過一種估值方法來評估TKO Group Holdings, Inc. (NYSE:TKO)作爲投資機會的吸引力,即採用預期未來現金流量並將其貼現至今天的價值。貼現現金流量(DCF)模型是我們將應用此方法的工具。不要因術語而放棄,其背後的數學實際上非常簡單。
現在,貼現現金流的最重要輸入是貼現率,以及實際現金流。您不必同意這些輸入,我建議您重新計算並與它們玩耍。DCF模型也沒有考慮行業的可能週期性,或公司未來的資本需求,因此它並不能全面地描述公司的潛在表現。鑑於我們看待TKO Group Holdings作爲潛在的股東,所以使用的是股權成本而不是資本成本(或加權平均資本成本(WACC)考慮了債務)。在這個計算中,我們使用了7.7%,這是基於槓桿貝塔爲1.160的計算。貝塔是衡量一支股票相對於整個市場的波動性的指標。我們從全球類似公司的行業平均貝塔值中獲取貝塔值,設定一個介於0.8和2.0之間的範圍,這是一個穩定業務的合理範圍。
TKO Group Holdings SWOT分析
優勢
淨債務與所有者權益比率低於40%。
TKO資產負債表摘要。
弱勢
債務利息支付能力不太好。
機會
預計明年盈虧相抵。
根據當前自由現金流,財務運營資金足夠支撐三年以上。
根據市銷率和估計的公平價值,TWKS的價值很好。
威脅
運營現金流無法很好地覆蓋債務。
TKO準備好處理威脅了嗎?
下一步:
估值只是建立投資論點的一面,當研究一家公司時,不應該只看估值。DCF模型並不是一個完美的股票估值工具。最好您應該應用不同的情況和假設,看看它們如何影響公司的估值。例如,公司股權成本或無風險利率的變化可能會顯着影響估值。對於TKO Group Holdings,除了估值之外,我們還編制了另外三個您應該進一步檢查的要素: