
While Shareholders of Owens & Minor (NYSE:OMI) Are in the Black Over 5 Years, Those Who Bought a Week Ago Aren't so Fortunate
While Shareholders of Owens & Minor (NYSE:OMI) Are in the Black Over 5 Years, Those Who Bought a Week Ago Aren't so Fortunate
The last three months have been tough on Owens & Minor, Inc. (NYSE:OMI) shareholders, who have seen the share price decline a rather worrying 34%. But that doesn't change the fact that the returns over the last half decade have been spectacular. Indeed, the share price is up a whopping 484% in that time. So it might be that some shareholders are taking profits after good performance. Of course what matters most is whether the business can improve itself sustainably, thus justifying a higher price. While the returns over the last 5 years have been good, we do feel sorry for those shareholders who haven't held shares that long, because the share price is down 62% in the last three years.
過去三個月對紐交所股票(NYSE:OMI)的股東來說都不好過,股價下跌了34%。但是,過去五年的回報率卻非常出色,股價上漲了整整484%。因此,有些股東可能會在表現良好後賣出股票以持有利潤。當然,最重要的是業務是否可以可持續地得到改善,從而證明更高的價格是合理的。雖然過去5年的回報率不錯,但我們確實爲那些沒有持有股票那麼長時間的股東感到遺憾,因爲過去三年股票下跌了62%。
Since the long term performance has been good but there's been a recent pullback of 5.5%, let's check if the fundamentals match the share price.
既然長期表現不錯,但最近出現了5.5%的回調,讓我們來檢查一下基本面是否符合股價。
While markets are a powerful pricing mechanism, share prices reflect investor sentiment, not just underlying business performance. One imperfect but simple way to consider how the market perception of a company has shifted is to compare the change in the earnings per share (EPS) with the share price movement.
雖然市場是一個強大的定價機制,但股價反映的不僅僅是企業的基本業績,還有投資者的情緒。一個不完美但簡單的方式來考慮公司市場意識的變化是比較每股收益(EPS)的變化和股價的變化。
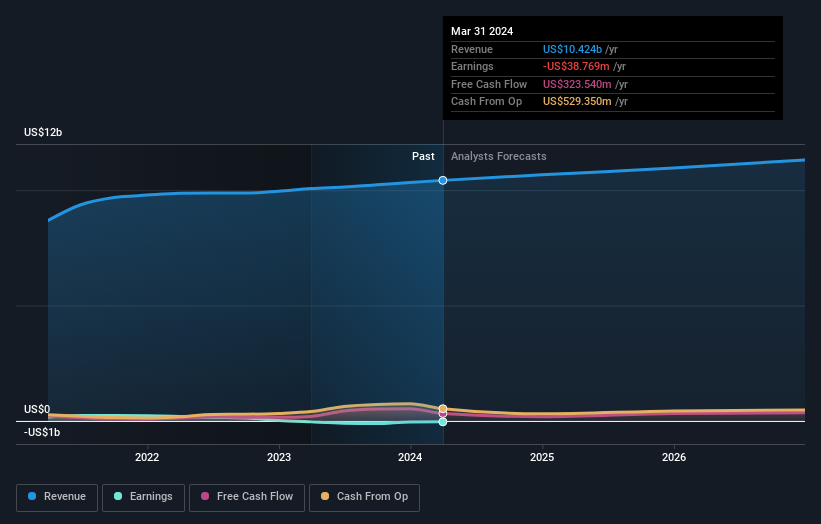
We know that Owens & Minor has been profitable in the past. However, it made a loss in the last twelve months, suggesting profit may be an unreliable metric at this stage. So we might find other metrics can better explain the share price movements.
我們知道Owens & Minor過去是有盈利的,但在過去的12個月中虧損,這表明在這個階段盈利可能是一種不可靠的指標。因此,我們可能會發現其他指標可以更好地解釋股價的波動。
On the other hand, Owens & Minor's revenue is growing nicely, at a compound rate of 3.4% over the last five years. In that case, the company may be sacrificing current earnings per share to drive growth.
另一方面,Owens & Minor的營業收入正在以複合增長率爲3.4%的速度增長。在這種情況下,公司可能會在推動增長的同時犧牲目前的每股收益。
The company's revenue and earnings (over time) are depicted in the image below (click to see the exact numbers).
以下圖像顯示了公司的營業收入和盈利(隨時間變化)(單擊以查看準確的數字)。
You can see how its balance sheet has strengthened (or weakened) over time in this free interactive graphic.
你可以在這個免費的互動圖表中看到它的資產負債表如何隨着時間的推移而加強(或削弱)。
A Different Perspective
不同的觀點
While the broader market gained around 23% in the last year, Owens & Minor shareholders lost 14%. However, keep in mind that even the best stocks will sometimes underperform the market over a twelve month period. Longer term investors wouldn't be so upset, since they would have made 42%, each year, over five years. If the fundamental data continues to indicate long term sustainable growth, the current sell-off could be an opportunity worth considering. I find it very interesting to look at share price over the long term as a proxy for business performance. But to truly gain insight, we need to consider other information, too. For instance, we've identified 1 warning sign for Owens & Minor that you should be aware of.
儘管更廣泛的市場在過去一年中上漲了約23%,但Owens & Minor的股東卻虧損了14%。但是,請記住,即使是最好的股票有時也會在12個月的時間內表現不佳。長期投資者不會那麼沮喪,因爲他們每年都會獲得42%的回報,而且是持續5年。如果基本數據繼續表明存在長期可持續增長的機會,當前的拋售可能是值得考慮的機會。我發現長期觀察股價可以作爲業務表現的代理很有意思。但是,爲了真正獲得洞察力,我們還需要考慮其他信息。例如,我們已經發現了Owens & Minor的1個警示信號,您應該知道。
Of course, you might find a fantastic investment by looking elsewhere. So take a peek at this free list of companies we expect will grow earnings.
當然,您可能在其他地方找到一家出色的企業進行投資。因此,請查看我們預計將實現盈利增長的公司的免費列表。
Please note, the market returns quoted in this article reflect the market weighted average returns of stocks that currently trade on American exchanges.
請注意,本文所引述的市場回報反映了目前在美國交易所上市的股票的市場加權平均回報。
Have feedback on this article? Concerned about the content? Get in touch with us directly. Alternatively, email editorial-team (at) simplywallst.com.
This article by Simply Wall St is general in nature. We provide commentary based on historical data and analyst forecasts only using an unbiased methodology and our articles are not intended to be financial advice. It does not constitute a recommendation to buy or sell any stock, and does not take account of your objectives, or your financial situation. We aim to bring you long-term focused analysis driven by fundamental data. Note that our analysis may not factor in the latest price-sensitive company announcements or qualitative material. Simply Wall St has no position in any stocks mentioned.
對本文有反饋?關於內容有所顧慮?直接和我們聯繫。或者,發送電子郵件至editorial-team (at) simplywallst.com。
這篇文章是Simply Wall St的一般性文章。我們根據歷史數據和分析師預測提供評論,只使用公正的方法論,我們的文章並不意味着提供任何金融建議。文章不構成買賣任何股票的建議,也不考慮您的目標或您的財務狀況。我們的目標是帶給您基本數據驅動的長期關注分析。請注意,我們的分析可能不考慮最新的價格敏感公司公告或定性材料。Simply Wall St沒有任何股票頭寸。
Have feedback on this article? Concerned about the content? Get in touch with us directly. Alternatively, email editorial-team@simplywallst.com
對本文有反饋?關於內容有所顧慮?直接和我們聯繫。或者發送電子郵件至editorial-team@simplywallst.com。
譯文內容由第三人軟體翻譯。