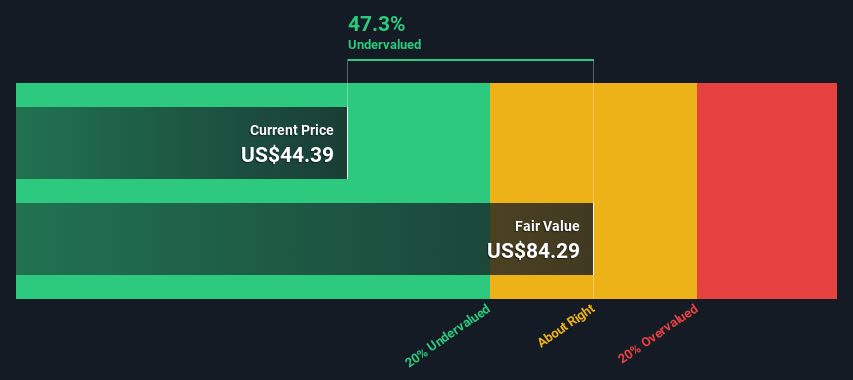
Using the 2 Stage Free Cash Flow to Equity, Silgan Holdings fair value estimate is US$84.29
Silgan Holdings' US$44.39 share price signals that it might be 47% undervalued
The US$52.36 analyst price target for SLGN is 38% less than our estimate of fair value
How far off is Silgan Holdings Inc. (NYSE:SLGN) from its intrinsic value? Using the most recent financial data, we'll take a look at whether the stock is fairly priced by taking the expected future cash flows and discounting them to today's value. One way to achieve this is by employing the Discounted Cash Flow (DCF) model. Before you think you won't be able to understand it, just read on! It's actually much less complex than you'd imagine.
Remember though, that there are many ways to estimate a company's value, and a DCF is just one method. If you still have some burning questions about this type of valuation, take a look at the Simply Wall St analysis model.
Is Silgan Holdings Fairly Valued?
We're using the 2-stage growth model, which simply means we take in account two stages of company's growth. In the initial period the company may have a higher growth rate and the second stage is usually assumed to have a stable growth rate. To begin with, we have to get estimates of the next ten years of cash flows. Where possible we use analyst estimates, but when these aren't available we extrapolate the previous free cash flow (FCF) from the last estimate or reported value. We assume companies with shrinking free cash flow will slow their rate of shrinkage, and that companies with growing free cash flow will see their growth rate slow, over this period. We do this to reflect that growth tends to slow more in the early years than it does in later years.
Generally we assume that a dollar today is more valuable than a dollar in the future, so we discount the value of these future cash flows to their estimated value in today's dollars:
10-year free cash flow (FCF) forecast
2024
2025
2026
2027
2028
2029
2030
2031
2032
2033
Levered FCF ($, Millions)
US$352.8m
US$389.8m
US$421.8m
US$446.2m
US$467.4m
US$486.4m
US$503.6m
US$519.7m
US$535.1m
US$549.9m
Growth Rate Estimate Source
Analyst x4
Analyst x4
Analyst x2
Est @ 5.79%
Est @ 4.77%
Est @ 4.05%
Est @ 3.55%
Est @ 3.20%
Est @ 2.95%
Est @ 2.78%
Present Value ($, Millions) Discounted @ 7.2%
US$329
US$339
US$342
US$338
US$330
US$321
US$310
US$298
US$286
US$274
("Est" = FCF growth rate estimated by Simply Wall St) Present Value of 10-year Cash Flow (PVCF) = US$3.2b
The second stage is also known as Terminal Value, this is the business's cash flow after the first stage. For a number of reasons a very conservative growth rate is used that cannot exceed that of a country's GDP growth. In this case we have used the 5-year average of the 10-year government bond yield (2.4%) to estimate future growth. In the same way as with the 10-year 'growth' period, we discount future cash flows to today's value, using a cost of equity of 7.2%.
Present Value of Terminal Value (PVTV)= TV / (1 + r)10= US$12b÷ ( 1 + 7.2%)10= US$5.8b
The total value is the sum of cash flows for the next ten years plus the discounted terminal value, which results in the Total Equity Value, which in this case is US$9.0b. To get the intrinsic value per share, we divide this by the total number of shares outstanding. Compared to the current share price of US$44.4, the company appears quite undervalued at a 47% discount to where the stock price trades currently. The assumptions in any calculation have a big impact on the valuation, so it is better to view this as a rough estimate, not precise down to the last cent.
NYSE:SLGN Discounted Cash Flow June 14th 2024
The Assumptions
The calculation above is very dependent on two assumptions. The first is the discount rate and the other is the cash flows. If you don't agree with these result, have a go at the calculation yourself and play with the assumptions. The DCF also does not consider the possible cyclicality of an industry, or a company's future capital requirements, so it does not give a full picture of a company's potential performance. Given that we are looking at Silgan Holdings as potential shareholders, the cost of equity is used as the discount rate, rather than the cost of capital (or weighted average cost of capital, WACC) which accounts for debt. In this calculation we've used 7.2%, which is based on a levered beta of 1.047. Beta is a measure of a stock's volatility, compared to the market as a whole. We get our beta from the industry average beta of globally comparable companies, with an imposed limit between 0.8 and 2.0, which is a reasonable range for a stable business.
SWOT Analysis for Silgan Holdings
Strength
Debt is well covered by earnings.
Dividends are covered by earnings and cash flows.
Dividend information for SLGN.
Weakness
Earnings declined over the past year.
Dividend is low compared to the top 25% of dividend payers in the Packaging market.
Opportunity
Annual earnings are forecast to grow for the next 3 years.
Good value based on P/E ratio and estimated fair value.
Threat
Debt is not well covered by operating cash flow.
Annual earnings are forecast to grow slower than the American market.
Is SLGN well equipped to handle threats?
Looking Ahead:
Whilst important, the DCF calculation is only one of many factors that you need to assess for a company. It's not possible to obtain a foolproof valuation with a DCF model. Preferably you'd apply different cases and assumptions and see how they would impact the company's valuation. For example, changes in the company's cost of equity or the risk free rate can significantly impact the valuation. Why is the intrinsic value higher than the current share price? For Silgan Holdings, we've put together three additional factors you should further examine:
Risks: For example, we've discovered 2 warning signs for Silgan Holdings (1 makes us a bit uncomfortable!) that you should be aware of before investing here.
Management:Have insiders been ramping up their shares to take advantage of the market's sentiment for SLGN's future outlook? Check out our management and board analysis with insights on CEO compensation and governance factors.
Other Solid Businesses: Low debt, high returns on equity and good past performance are fundamental to a strong business. Why not explore our interactive list of stocks with solid business fundamentals to see if there are other companies you may not have considered!
PS. The Simply Wall St app conducts a discounted cash flow valuation for every stock on the NYSE every day. If you want to find the calculation for other stocks just search here.
Have feedback on this article? Concerned about the content?Get in touch with us directly. Alternatively, email editorial-team (at) simplywallst.com. This article by Simply Wall St is general in nature. We provide commentary based on historical data and analyst forecasts only using an unbiased methodology and our articles are not intended to be financial advice. It does not constitute a recommendation to buy or sell any stock, and does not take account of your objectives, or your financial situation. We aim to bring you long-term focused analysis driven by fundamental data. Note that our analysis may not factor in the latest price-sensitive company announcements or qualitative material. Simply Wall St has no position in any stocks mentioned.
Have feedback on this article? Concerned about the content? Get in touch with us directly. Alternatively, email editorial-team@simplywallst.com

 Generally we assume that a dollar today is more valuable than a dollar in the future, so we discount the value of these future cash flows to their estimated value in today's dollars:
  通常我們認爲今天的一美元比未來的一美元更有價值,因此我們將這些未來的現金流折現爲今天的估計價值: