
While DexCom, Inc. (NASDAQ:DXCM) shareholders are probably generally happy, the stock hasn't had particularly good run recently, with the share price falling 13% in the last quarter. But that doesn't change the fact that shareholders have received really good returns over the last five years. We think most investors would be happy with the 192% return, over that period. Generally speaking the long term returns will give you a better idea of business quality than short periods can. Ultimately business performance will determine whether the stock price continues the positive long term trend.
With that in mind, it's worth seeing if the company's underlying fundamentals have been the driver of long term performance, or if there are some discrepancies.
To quote Buffett, 'Ships will sail around the world but the Flat Earth Society will flourish. There will continue to be wide discrepancies between price and value in the marketplace...' One flawed but reasonable way to assess how sentiment around a company has changed is to compare the earnings per share (EPS) with the share price.
During the last half decade, DexCom became profitable. That kind of transition can be an inflection point that justifies a strong share price gain, just as we have seen here. Since the company was unprofitable five years ago, but not three years ago, it's worth taking a look at the returns in the last three years, too. Indeed, the DexCom share price has gained 10% in three years. During the same period, EPS grew by 5.0% each year. This EPS growth is higher than the 3% average annual increase in the share price over the same three years. Therefore, it seems the market has moderated its expectations for growth, somewhat. Of course, with a P/E ratio of 70.80, the market remains optimistic.
You can see how EPS has changed over time in the image below (click on the chart to see the exact values).
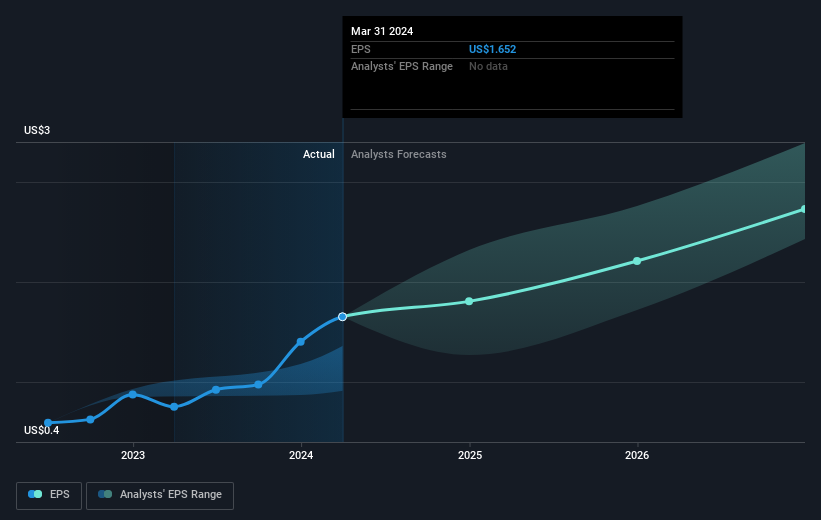
We know that DexCom has improved its bottom line lately, but is it going to grow revenue? You could check out this free report showing analyst revenue forecasts.
A Different Perspective
Investors in DexCom had a tough year, with a total loss of 13%, against a market gain of about 23%. However, keep in mind that even the best stocks will sometimes underperform the market over a twelve month period. Longer term investors wouldn't be so upset, since they would have made 24%, each year, over five years. If the fundamental data continues to indicate long term sustainable growth, the current sell-off could be an opportunity worth considering. It's always interesting to track share price performance over the longer term. But to understand DexCom better, we need to consider many other factors. Even so, be aware that DexCom is showing 1 warning sign in our investment analysis , you should know about...
If you are like me, then you will not want to miss this free list of undervalued small caps that insiders are buying.
Please note, the market returns quoted in this article reflect the market weighted average returns of stocks that currently trade on American exchanges.
Have feedback on this article? Concerned about the content? Get in touch with us directly. Alternatively, email editorial-team (at) simplywallst.com.
This article by Simply Wall St is general in nature. We provide commentary based on historical data and analyst forecasts only using an unbiased methodology and our articles are not intended to be financial advice. It does not constitute a recommendation to buy or sell any stock, and does not take account of your objectives, or your financial situation. We aim to bring you long-term focused analysis driven by fundamental data. Note that our analysis may not factor in the latest price-sensitive company announcements or qualitative material. Simply Wall St has no position in any stocks mentioned.
Have feedback on this article? Concerned about the content? Get in touch with us directly. Alternatively, email editorial-team@simplywallst.com