
It is hard to get excited after looking at Cooper Companies' (NASDAQ:COO) recent performance, when its stock has declined 6.6% over the past three months. It seems that the market might have completely ignored the positive aspects of the company's fundamentals and decided to weigh-in more on the negative aspects. Long-term fundamentals are usually what drive market outcomes, so it's worth paying close attention. In this article, we decided to focus on Cooper Companies' ROE.
Return on Equity or ROE is a test of how effectively a company is growing its value and managing investors' money. Put another way, it reveals the company's success at turning shareholder investments into profits.
How To Calculate Return On Equity?
Return on equity can be calculated by using the formula:
Return on Equity = Net Profit (from continuing operations) ÷ Shareholders' Equity
So, based on the above formula, the ROE for Cooper Companies is:
4.4% = US$340m ÷ US$7.8b (Based on the trailing twelve months to April 2024).
The 'return' refers to a company's earnings over the last year. Another way to think of that is that for every $1 worth of equity, the company was able to earn $0.04 in profit.
What Has ROE Got To Do With Earnings Growth?
Thus far, we have learned that ROE measures how efficiently a company is generating its profits. Based on how much of its profits the company chooses to reinvest or "retain", we are then able to evaluate a company's future ability to generate profits. Generally speaking, other things being equal, firms with a high return on equity and profit retention, have a higher growth rate than firms that don't share these attributes.
A Side By Side comparison of Cooper Companies' Earnings Growth And 4.4% ROE
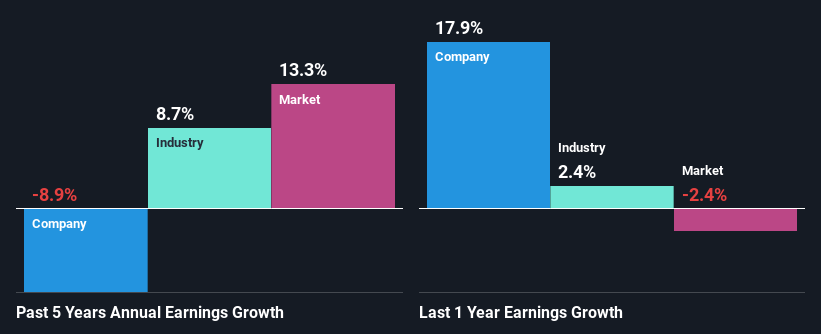
It is quite clear that Cooper Companies' ROE is rather low. Even compared to the average industry ROE of 11%, the company's ROE is quite dismal. For this reason, Cooper Companies' five year net income decline of 8.9% is not surprising given its lower ROE. However, there could also be other factors causing the earnings to decline. For example, the business has allocated capital poorly, or that the company has a very high payout ratio.
So, as a next step, we compared Cooper Companies' performance against the industry and were disappointed to discover that while the company has been shrinking its earnings, the industry has been growing its earnings at a rate of 8.7% over the last few years.
The basis for attaching value to a company is, to a great extent, tied to its earnings growth. It's important for an investor to know whether the market has priced in the company's expected earnings growth (or decline). This then helps them determine if the stock is placed for a bright or bleak future. What is COO worth today? The intrinsic value infographic in our free research report helps visualize whether COO is currently mispriced by the market.
Is Cooper Companies Using Its Retained Earnings Effectively?
While the company did payout a portion of its dividend in the past, it currently doesn't pay a regular dividend. This implies that potentially all of its profits are being reinvested in the business.
Summary
In total, we're a bit ambivalent about Cooper Companies' performance. Even though it appears to be retaining most of its profits, given the low ROE, investors may not be benefitting from all that reinvestment after all. The low earnings growth suggests our theory correct. That being so, the latest industry analyst forecasts show that the analysts are expecting to see a huge improvement in the company's earnings growth rate. To know more about the latest analysts predictions for the company, check out this visualization of analyst forecasts for the company.
Have feedback on this article? Concerned about the content? Get in touch with us directly. Alternatively, email editorial-team (at) simplywallst.com.
This article by Simply Wall St is general in nature. We provide commentary based on historical data and analyst forecasts only using an unbiased methodology and our articles are not intended to be financial advice. It does not constitute a recommendation to buy or sell any stock, and does not take account of your objectives, or your financial situation. We aim to bring you long-term focused analysis driven by fundamental data. Note that our analysis may not factor in the latest price-sensitive company announcements or qualitative material. Simply Wall St has no position in any stocks mentioned.