
Do Its Financials Have Any Role To Play In Driving Full Truck Alliance Co. Ltd.'s (NYSE:YMM) Stock Up Recently?
Do Its Financials Have Any Role To Play In Driving Full Truck Alliance Co. Ltd.'s (NYSE:YMM) Stock Up Recently?
Full Truck Alliance's (NYSE:YMM) stock is up by a considerable 14% over the past three months. We wonder if and what role the company's financials play in that price change as a company's long-term fundamentals usually dictate market outcomes. Specifically, we decided to study Full Truck Alliance's ROE in this article.
過去三個月,滿帝卡(NYSE:YMM)的股價上漲了14%。我們想知道公司的財務狀況在這種價格波動中扮演了什麼角色,因爲公司的長期基本面通常決定市場結果。具體來說,我們決定在本文中研究一下滿帝卡的ROE。
ROE or return on equity is a useful tool to assess how effectively a company can generate returns on the investment it received from its shareholders. In other words, it is a profitability ratio which measures the rate of return on the capital provided by the company's shareholders.
roe,即淨資產收益率,是一種評估公司如何有效地從股東手中獲取投資回報的有用工具。換句話說,它是一種盈利能力比率,衡量公司股東提供的資本的回報率。
How Is ROE Calculated?
淨資產收益率怎麼計算?
The formula for ROE is:
roe的公式是:
Return on Equity = Net Profit (from continuing operations) ÷ Shareholders' Equity
淨資產收益率 = 淨利潤(從持續經營中獲得)÷ 股東權益
So, based on the above formula, the ROE for Full Truck Alliance is:
因此,根據上述公式,滿帝卡的ROE爲:
6.8% = CN¥2.4b ÷ CN¥35b (Based on the trailing twelve months to March 2024).
6.8%=CN¥2.4b ÷ CN¥35b (基於截至2024年3月的過去12個月)。
The 'return' is the income the business earned over the last year. One way to conceptualize this is that for each $1 of shareholders' capital it has, the company made $0.07 in profit.
“收益率”是企業在過去一年中獲得的收入。一個概念化的方法是,對於每1美元的股東資本,公司實現了0.07美元的利潤。
What Is The Relationship Between ROE And Earnings Growth?
既然我們已經確定ROE是一種有效的利潤生成標準,用於評估公司未來的盈利能力,我們現在需要評估公司“保留”爲未來增長而重新投資的利潤多少,這使我們對公司的增長潛力有了一個了解。一般而言,在其他條件相等的情況下,ROE和利潤留存高的公司,增長率比沒有這些屬性的公司要高。
We have already established that ROE serves as an efficient profit-generating gauge for a company's future earnings. We now need to evaluate how much profit the company reinvests or "retains" for future growth which then gives us an idea about the growth potential of the company. Assuming everything else remains unchanged, the higher the ROE and profit retention, the higher the growth rate of a company compared to companies that don't necessarily bear these characteristics.
我們已經確定了roe作爲衡量公司未來收益的有效收益率。現在我們需要評估公司再投資或“保留”的利潤,以便了解公司的增長潛力。假設其他一切不變,ROE和利潤保留率越高,公司的增長率就越高,而與不一定具備這些特徵的公司相比。
Full Truck Alliance's Earnings Growth And 6.8% ROE
滿帝卡的收益增長和ROE爲6.8%
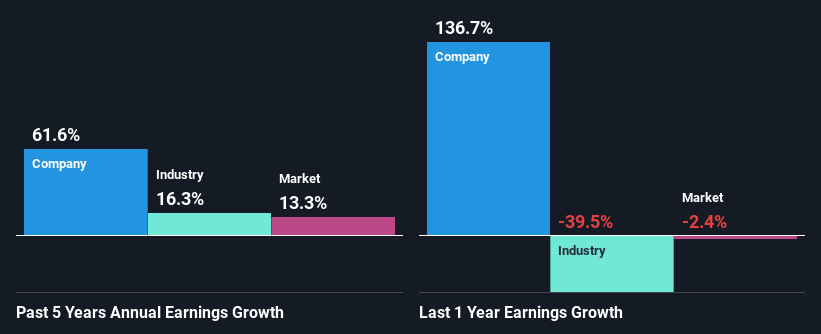
At first glance, Full Truck Alliance's ROE doesn't look very promising. A quick further study shows that the company's ROE doesn't compare favorably to the industry average of 11% either. Despite this, surprisingly, Full Truck Alliance saw an exceptional 62% net income growth over the past five years. Therefore, there could be other reasons behind this growth. For instance, the company has a low payout ratio or is being managed efficiently.
乍一看,滿帝卡的ROE似乎並不令人興奮。進一步的研究顯示,公司的ROE也不如11%的行業平均水平。儘管如此,令人驚訝的是,滿帝卡在過去五年中實現了62%的淨利潤增長。因此,可能有其他原因促成了這種增長。例如,公司具有較低的派息比或被有效管理。
We then compared Full Truck Alliance's net income growth with the industry and we're pleased to see that the company's growth figure is higher when compared with the industry which has a growth rate of 16% in the same 5-year period.
然後,我們將滿帝卡的淨利潤增長與行業進行比較,很高興看到公司的增長率比同一5年期內的行業增長率16%更高。
The basis for attaching value to a company is, to a great extent, tied to its earnings growth. The investor should try to establish if the expected growth or decline in earnings, whichever the case may be, is priced in. By doing so, they will have an idea if the stock is headed into clear blue waters or if swampy waters await. If you're wondering about Full Truck Alliance's's valuation, check out this gauge of its price-to-earnings ratio, as compared to its industry.
對於股票價值的定價在很大程度上與其收益增長有關。投資者應該試圖確定是否已經定價並考慮未來收益增長或下降的情況,無論哪種情況,都可以知道股票是否會進入清晰的藍色水域或者是陷入困境。如果您想了解滿帝卡的估值,請查看其市盈率與所屬行業的比較。
Is Full Truck Alliance Making Efficient Use Of Its Profits?
滿帝卡是否有效地利用其利潤?
Full Truck Alliance has a three-year median payout ratio of 47% (where it is retaining 53% of its income) which is not too low or not too high. By the looks of it, the dividend is well covered and Full Truck Alliance is reinvesting its profits efficiently as evidenced by its exceptional growth which we discussed above.
滿帝卡的三年中位派息比爲47%(保留53%的收入),既不太低也不太高。從這個角度看,股息得到很好的覆蓋,而滿帝卡正在有效地重新投資其利潤,正如我們上面討論的那樣,其增長十分顯著。
Our latest analyst data shows that the future payout ratio of the company is expected to drop to 25% over the next three years. Accordingly, the expected drop in the payout ratio explains the expected increase in the company's ROE to 11%, over the same period.
我們最新的分析師數據顯示,該公司未來派息比預計將在未來三年內降至25%。因此,預期的派息比下降解釋了同一時期該公司ROE預計達到11%的原因。
Conclusion
結論
In total, it does look like Full Truck Alliance has some positive aspects to its business. With a high rate of reinvestment, albeit at a low ROE, the company has managed to see a considerable growth in its earnings. That being so, a study of the latest analyst forecasts show that the company is expected to see a slowdown in its future earnings growth. To know more about the latest analysts predictions for the company, check out this visualization of analyst forecasts for the company.
總的來說,滿帝卡的業務有一些積極因素。對於高比率的再投資,儘管ROE比較低,但公司已成功地實現了利潤的相當大的增長。即便如此,對最新的分析師預測的研究顯示,該公司未來的盈利增長可能會放緩。了解有關該公司最新分析師預測的更多信息,請查看這家公司的分析師預測可視化。
Have feedback on this article? Concerned about the content? Get in touch with us directly. Alternatively, email editorial-team (at) simplywallst.com.
This article by Simply Wall St is general in nature. We provide commentary based on historical data and analyst forecasts only using an unbiased methodology and our articles are not intended to be financial advice. It does not constitute a recommendation to buy or sell any stock, and does not take account of your objectives, or your financial situation. We aim to bring you long-term focused analysis driven by fundamental data. Note that our analysis may not factor in the latest price-sensitive company announcements or qualitative material. Simply Wall St has no position in any stocks mentioned.
對本文有反饋?關於內容有所顧慮?直接和我們聯繫。或者,發送電子郵件至editorial-team (at) simplywallst.com。
這篇文章是Simply Wall St的一般性文章。我們根據歷史數據和分析師預測提供評論,只使用公正的方法論,我們的文章並不意味着提供任何金融建議。文章不構成買賣任何股票的建議,也不考慮您的目標或您的財務狀況。我們的目標是帶給您基本數據驅動的長期關注分析。請注意,我們的分析可能不考慮最新的價格敏感公司公告或定性材料。Simply Wall St沒有任何股票頭寸。
譯文內容由第三人軟體翻譯。