
Reinsurance Group of America (NYSE:RGA) Shareholders Have Earned a 20% CAGR Over the Last Three Years
Reinsurance Group of America (NYSE:RGA) Shareholders Have Earned a 20% CAGR Over the Last Three Years
One simple way to benefit from the stock market is to buy an index fund. But if you choose individual stocks with prowess, you can make superior returns. For example, the Reinsurance Group of America, Incorporated (NYSE:RGA) share price is up 63% in the last three years, clearly besting the market return of around 14% (not including dividends). However, more recent returns haven't been as impressive as that, with the stock returning just 42% in the last year, including dividends.
從股市中獲益的一種簡單的方式是購買指數基金。但如果您選擇具有實力的個股,您可以獲得更優異的回報。例如,Reinsurance Group of America, Incorporated (NYSE:RGA) 的股票價格在過去三年中上漲了63%,明顯優於市場回報約14%(不包括股息)。然而,更近期的回報並不如此令人印象深刻,包括分紅在內,上一年該股票的回報僅爲42%。
Now it's worth having a look at the company's fundamentals too, because that will help us determine if the long term shareholder return has matched the performance of the underlying business.
現在值得更詳細地了解該公司的基本面,因爲這將幫助我們判斷長期股東回報是否與基礎業務的表現相匹配。
To quote Buffett, 'Ships will sail around the world but the Flat Earth Society will flourish. There will continue to be wide discrepancies between price and value in the marketplace...' By comparing earnings per share (EPS) and share price changes over time, we can get a feel for how investor attitudes to a company have morphed over time.
引用巴菲特的話順便說一下,“船隻將環遊世界,但支持地球平面學會的人將大有可爲。 在市場上,價格和價值之間將繼續存在巨大的差異...”通過比較EPS和股價變化,我們可以了解到投資者對公司的態度隨時間的變化程度。
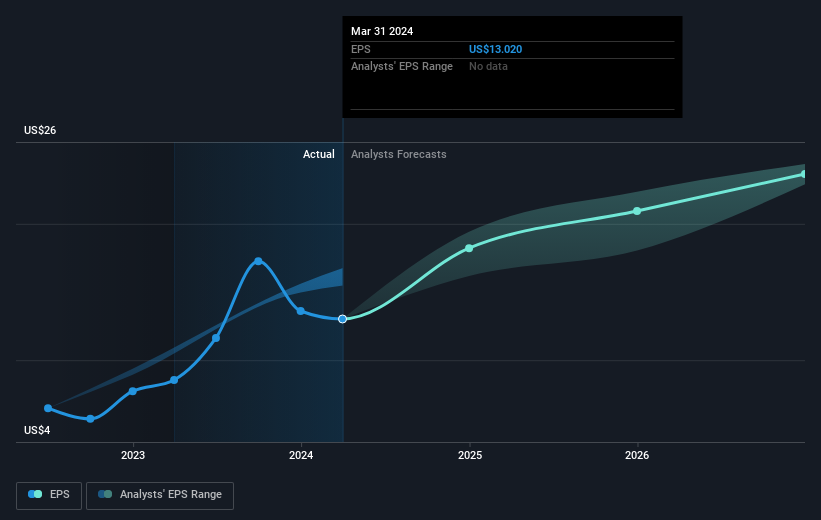
During three years of share price growth, Reinsurance Group of America achieved compound earnings per share growth of 11% per year. In comparison, the 18% per year gain in the share price outpaces the EPS growth. This indicates that the market is feeling more optimistic on the stock, after the last few years of progress. That's not necessarily surprising considering the three-year track record of earnings growth.
在三年的股價增長期間,美國再保險集團的複合每股收益增長率爲11%。相比之下,股價每年增長18%,超過了每股收益的增長。這表明市場對該股票更加樂觀,畢竟在過去幾年取得了進展。考慮到過去三年的盈利增長紀錄,這並不意外。
You can see below how EPS has changed over time (discover the exact values by clicking on the image).
下面可以看到每股收益隨時間的變化情況(通過點擊圖像來查看確切數值)。
We're pleased to report that the CEO is remunerated more modestly than most CEOs at similarly capitalized companies. But while CEO remuneration is always worth checking, the really important question is whether the company can grow earnings going forward. Before buying or selling a stock, we always recommend a close examination of historic growth trends, available here..
我們很高興報告說,該公司的CEO薪酬比同等資本化公司中的大多數CEO要低得多。但是,儘管CEO薪酬值得檢查,但真正重要的問題是該公司是否能夠在未來增長收益。在買入或賣出股票之前,我們始終建議進行歷史增長趨勢的仔細研究,可以在這裏獲得歷史數據。
What About Dividends?
那麼分紅怎麼樣呢?
When looking at investment returns, it is important to consider the difference between total shareholder return (TSR) and share price return. The TSR incorporates the value of any spin-offs or discounted capital raisings, along with any dividends, based on the assumption that the dividends are reinvested. So for companies that pay a generous dividend, the TSR is often a lot higher than the share price return. As it happens, Reinsurance Group of America's TSR for the last 3 years was 75%, which exceeds the share price return mentioned earlier. And there's no prize for guessing that the dividend payments largely explain the divergence!
在考慮投資回報時,重要的是考慮總股東回報(TSR)和股票回報之間的差異。 TSR包括任何剝離或折讓的資本籌集(基於股息被重新投資的假設),以及任何股息。因此,對於支付慷慨的股息公司而言,TSR通常比股票回報高得多。就中國神威藥業集團而言,其TSR在過去5年中達到了75%。這超過了我們之前提到的股票回報。該公司支付的股息已經提高了總股東回報。總股東回報和股票回報TSR(總股東回報)考慮了任何分拆或折價募資的價值,以及任何股息,基於股息再投資的假設。因此,對於支付豐厚股息的公司,TSR通常比股票價格回報高得多。恰好RGA公司在過去的3年裏的TSR爲75%,超過了前面提到的股票回報。而且毫無疑問,股息支付在很大程度上解釋了這種分歧!
A Different Perspective
不同的觀點
It's nice to see that Reinsurance Group of America shareholders have received a total shareholder return of 42% over the last year. That's including the dividend. That gain is better than the annual TSR over five years, which is 8%. Therefore it seems like sentiment around the company has been positive lately. Someone with an optimistic perspective could view the recent improvement in TSR as indicating that the business itself is getting better with time. Most investors take the time to check the data on insider transactions. You can click here to see if insiders have been buying or selling.
很高興看到美國再保險集團的股東在過去一年中獲得了42%的總股東回報,其中包括股息。這一收益優於五年內的年均TSR(8%)。因此,近期該公司的股票情緒似乎相當積極。持有樂觀態度的人可能會認爲,TSR的最近改善表明該業務本身正在變得更好。大多數投資者都會花時間檢查內部交易數據。您可以單擊此處查看內部人是否一直在購買或出售。
For those who like to find winning investments this free list of undervalued companies with recent insider purchasing, could be just the ticket.
對於那些喜歡尋找獲勝投資的人來說,最近有內部購買的低估公司免費列表可能是一個很好的選擇。
Please note, the market returns quoted in this article reflect the market weighted average returns of stocks that currently trade on American exchanges.
請注意,本文所引述的市場回報反映了目前在美國交易所上市的股票的市場加權平均回報。
Have feedback on this article? Concerned about the content? Get in touch with us directly. Alternatively, email editorial-team (at) simplywallst.com.
This article by Simply Wall St is general in nature. We provide commentary based on historical data and analyst forecasts only using an unbiased methodology and our articles are not intended to be financial advice. It does not constitute a recommendation to buy or sell any stock, and does not take account of your objectives, or your financial situation. We aim to bring you long-term focused analysis driven by fundamental data. Note that our analysis may not factor in the latest price-sensitive company announcements or qualitative material. Simply Wall St has no position in any stocks mentioned.
對本文有反饋?關於內容有所顧慮?直接和我們聯繫。或者,發送電子郵件至editorial-team (at) simplywallst.com。
這篇文章是Simply Wall St的一般性文章。我們根據歷史數據和分析師預測提供評論,只使用公正的方法論,我們的文章並不意味着提供任何金融建議。文章不構成買賣任何股票的建議,也不考慮您的目標或您的財務狀況。我們的目標是帶給您基本數據驅動的長期關注分析。請注意,我們的分析可能不考慮最新的價格敏感公司公告或定性材料。Simply Wall St沒有任何股票頭寸。
譯文內容由第三人軟體翻譯。