
KBR's (NYSE:KBR) Investors Will Be Pleased With Their Splendid 177% Return Over the Last Five Years
KBR's (NYSE:KBR) Investors Will Be Pleased With Their Splendid 177% Return Over the Last Five Years
The worst result, after buying shares in a company (assuming no leverage), would be if you lose all the money you put in. But on a lighter note, a good company can see its share price rise well over 100%. For example, the KBR, Inc. (NYSE:KBR) share price has soared 162% in the last half decade. Most would be very happy with that. Meanwhile the share price is 2.1% higher than it was a week ago.
買入某公司股票(不考慮槓桿),最糟糕的結果是虧掉所有本金。但是好的公司,股票價格可以上漲100%以上。例如,KBR,Inc.(紐交所:KBR)股票價格在過去五年中飆升了162%。大多數人會對此感到非常高興。同時,股票價格較上週上漲2.1%。
Let's take a look at the underlying fundamentals over the longer term, and see if they've been consistent with shareholders returns.
讓我們長期看一下潛在的基本面,看看它們是否與股東回報一致。
There is no denying that markets are sometimes efficient, but prices do not always reflect underlying business performance. One flawed but reasonable way to assess how sentiment around a company has changed is to compare the earnings per share (EPS) with the share price.
市場有時毫無疑問是有效的,但股票價格並不總是反映基本業務表現。一種有缺陷但合理的方法是比較每股收益(EPS)和股票價格,以評估圍繞公司的情緒如何變化。
KBR's earnings per share are down 37% per year, despite strong share price performance over five years. The impact of extraordinary items on earnings, in the last year, partially explain the diversion.
儘管KBR股票表現強勁,但每股收益年降37%。去年非常項目對經營業績造成的影響在一定程度上解釋了這種分歧。
This means it's unlikely the market is judging the company based on earnings growth. Because earnings per share don't seem to match up with the share price, we'll take a look at other metrics instead.
這意味着市場不太可能根據盈利增長來評估該公司。由於每股收益似乎與股價不匹配,因此我們將查看其他度量標準。相比之下,每年8.3%的營業收入增長可能被視爲 Leidos Holdings 在增長,是一個真正的積極因素。現在,管理層很可能優先考慮營業收入增長而不是每股收益增長。
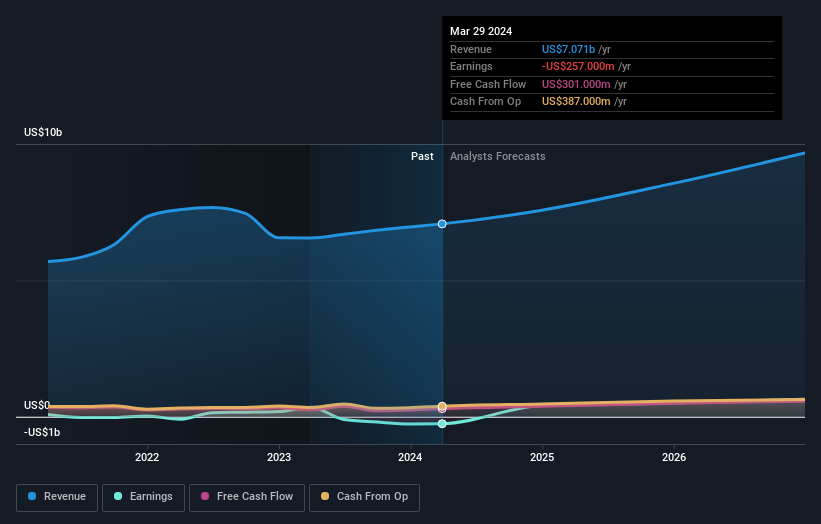
The modest 0.9% dividend yield is unlikely to be propping up the share price. On the other hand, KBR's revenue is growing nicely, at a compound rate of 6.3% over the last five years. In that case, the company may be sacrificing current earnings per share to drive growth.
較低的0.9%的股息收益率不可能支撐股票價格。另一方面,KBR的營業收入在過去五年中以6.3%的複合增長率增長,可以犧牲當前每股利潤來推動增長。
The graphic below depicts how earnings and revenue have changed over time (unveil the exact values by clicking on the image).
下面的圖表顯示了收益和營收隨時間的變化情況(通過單擊圖像揭示確切的值)。
We like that insiders have been buying shares in the last twelve months. Having said that, most people consider earnings and revenue growth trends to be a more meaningful guide to the business. You can see what analysts are predicting for KBR in this interactive graph of future profit estimates.
我們喜歡看到內部人員在過去十二個月中一直在購買股票。儘管如此,大多數人認爲盈利和營收增長趨勢更具有指導意義。您可以通過這個未來盈利預估交互式圖表來看看分析師們對KBR的預測。
What About Dividends?
那麼分紅怎麼樣呢?
As well as measuring the share price return, investors should also consider the total shareholder return (TSR). Whereas the share price return only reflects the change in the share price, the TSR includes the value of dividends (assuming they were reinvested) and the benefit of any discounted capital raising or spin-off. Arguably, the TSR gives a more comprehensive picture of the return generated by a stock. In the case of KBR, it has a TSR of 177% for the last 5 years. That exceeds its share price return that we previously mentioned. This is largely a result of its dividend payments!
除了衡量股票價格回報之外,投資者還應考慮股東總回報(TSR)。股票價格回報只是反映了股票價格的變化,股東總回報(TSR)則包括股息的價值(假設進行了再投資)以及任何折價資本籌集或剝離的利益。在某種程度上,股東總回報(TSR)給出了一張更全面的股票回報圖。對於KBR而言,過去5年中,股東總回報(TSR)爲177%。這超過了我們之前提到的股票價格回報。這主要是由於其股息支付帶來的效益。
A Different Perspective
不同的觀點
KBR shareholders are down 0.6% for the year (even including dividends), but the market itself is up 23%. Even the share prices of good stocks drop sometimes, but we want to see improvements in the fundamental metrics of a business, before getting too interested. Longer term investors wouldn't be so upset, since they would have made 23%, each year, over five years. It could be that the recent sell-off is an opportunity, so it may be worth checking the fundamental data for signs of a long term growth trend. Investors who like to make money usually check up on insider purchases, such as the price paid, and total amount bought. You can find out about the insider purchases of KBR by clicking this link.
KBR股東今年已經虧損了0.6%(即使包括股息),但市場本身上漲了23%。即使好的股票有時也會下跌,但我們希望看到業務基本數據的改善,然後再表現出興趣。長期投資者不會那麼煩惱,因爲他們每年都可以獲得23%的回報。最近的拋售可能是一個機會,因此值得檢查基本數據是否顯示出長期增長趨勢。想賺錢的投資者通常會檢查內部人員的購買情況,如實際支付的價格和購買的總金額,您可以通過單擊此鏈接了解有關KBR內幕交易的信息。
KBR is not the only stock insiders are buying. So take a peek at this free list of small cap companies at attractive valuations which insiders have been buying.
KBR並不是唯一一家內部人員正在購買的股票。因此,看看這個免費的小盤公司優惠估值列表,裏面有內部人員一直在購買。
Please note, the market returns quoted in this article reflect the market weighted average returns of stocks that currently trade on American exchanges.
請注意,本文所引述的市場回報反映了目前在美國交易所上市的股票的市場加權平均回報。
Have feedback on this article? Concerned about the content? Get in touch with us directly. Alternatively, email editorial-team (at) simplywallst.com.
This article by Simply Wall St is general in nature. We provide commentary based on historical data and analyst forecasts only using an unbiased methodology and our articles are not intended to be financial advice. It does not constitute a recommendation to buy or sell any stock, and does not take account of your objectives, or your financial situation. We aim to bring you long-term focused analysis driven by fundamental data. Note that our analysis may not factor in the latest price-sensitive company announcements or qualitative material. Simply Wall St has no position in any stocks mentioned.
對本文有反饋?關於內容有所顧慮?直接和我們聯繫。或者,發送電子郵件至editorial-team (at) simplywallst.com。
這篇文章是Simply Wall St的一般性文章。我們根據歷史數據和分析師預測提供評論,只使用公正的方法論,我們的文章並不意味着提供任何金融建議。文章不構成買賣任何股票的建議,也不考慮您的目標或您的財務狀況。我們的目標是帶給您基本數據驅動的長期關注分析。請注意,我們的分析可能不考慮最新的價格敏感公司公告或定性材料。Simply Wall St沒有任何股票頭寸。
譯文內容由第三人軟體翻譯。