
Shareholders in Newmont (NYSE:NEM) Are in the Red If They Invested Three Years Ago
Shareholders in Newmont (NYSE:NEM) Are in the Red If They Invested Three Years Ago
Newmont Corporation (NYSE:NEM) shareholders should be happy to see the share price up 18% in the last quarter. But that doesn't change the fact that the returns over the last three years have been less than pleasing. In fact, the share price is down 41% in the last three years, falling well short of the market return.
紐曼礦業公司(NYSE:NEM)的股東應該很高興看到股價在上個季度上漲了18%。但這並不能改變過去三年的收益不盡人意的事實。事實上,過去三年,股價下跌了41%,遠遠低於市場回報。
Since shareholders are down over the longer term, lets look at the underlying fundamentals over the that time and see if they've been consistent with returns.
由於股東們長期以來都虧損了,因此讓我們回顧過去一段時間的基本面,看看是否一直與收益相一致。
There is no denying that markets are sometimes efficient, but prices do not always reflect underlying business performance. One flawed but reasonable way to assess how sentiment around a company has changed is to compare the earnings per share (EPS) with the share price.
市場有時毫無疑問是有效的,但股票價格並不總是反映基本業務表現。一種有缺陷但合理的方法是比較每股收益(EPS)和股票價格,以評估圍繞公司的情緒如何變化。
We know that Newmont has been profitable in the past. However, it made a loss in the last twelve months, suggesting profit may be an unreliable metric at this stage. Other metrics may better explain the share price move.
我們知道紐曼過去一直是盈利的,但是在過去的12個月中,它出現了虧損,這表明利潤可能是一個不可靠的指標。其他指標可能更好地解釋了股價變化。
The company has kept revenue pretty healthy over the last three years, so we doubt that explains the falling share price. There doesn't seem to be any clear correlation between the fundamental business metrics and the share price. That could mean that the stock was previously overrated, or it could spell opportunity now.
公司在過去三年中的營業收入一直非常健康,因此我們懷疑這解釋了股價下跌的原因。基本業務指標與股價之間似乎沒有明顯的相關性。這可能意味着該股票曾被高估,或者現在可能是機會。
The company's revenue and earnings (over time) are depicted in the image below (click to see the exact numbers).
以下圖像顯示了公司的營業收入和盈利(隨時間變化)(單擊以查看準確的數字)。
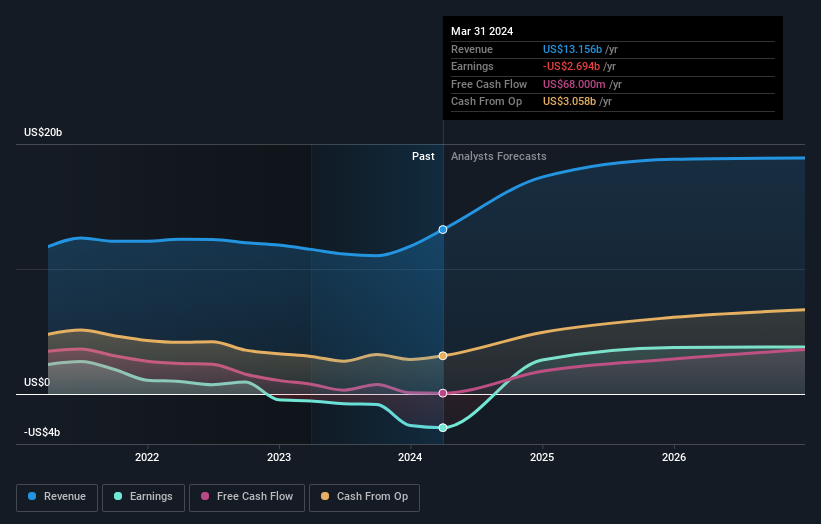
Newmont is a well known stock, with plenty of analyst coverage, suggesting some visibility into future growth. So it makes a lot of sense to check out what analysts think Newmont will earn in the future (free analyst consensus estimates)
紐曼是一隻衆所周知的股票,有許多分析師對其進行了覆蓋,表明了一些對未來增長的預期。因此,了解分析師對紐曼未來收益的預測(免費分析師共識預測)是非常有意義的。
What About Dividends?
那麼分紅怎麼樣呢?
As well as measuring the share price return, investors should also consider the total shareholder return (TSR). Whereas the share price return only reflects the change in the share price, the TSR includes the value of dividends (assuming they were reinvested) and the benefit of any discounted capital raising or spin-off. It's fair to say that the TSR gives a more complete picture for stocks that pay a dividend. As it happens, Newmont's TSR for the last 3 years was -34%, which exceeds the share price return mentioned earlier. The dividends paid by the company have thusly boosted the total shareholder return.
除了衡量股票價格的回報率之外,投資者還應考慮總股東回報率(TSR)。股票價格回報率僅反映了股票價格的變化,而TSR包括股息的價值(假設它們被再投資)和任何折價的籌資或分拆的利益。可以說TSR爲支付股息的股票提供了更完整的圖片。恰好紐曼過去三年的TSR爲-34%,超過了前面提到的股價回報率。公司支付的股息因此提高了投資回報。總股東回報。
A Different Perspective
不同的觀點
Investors in Newmont had a tough year, with a total loss of 0.9% (including dividends), against a market gain of about 23%. Even the share prices of good stocks drop sometimes, but we want to see improvements in the fundamental metrics of a business, before getting too interested. Longer term investors wouldn't be so upset, since they would have made 6%, each year, over five years. If the fundamental data continues to indicate long term sustainable growth, the current sell-off could be an opportunity worth considering. I find it very interesting to look at share price over the long term as a proxy for business performance. But to truly gain insight, we need to consider other information, too. Case in point: We've spotted 2 warning signs for Newmont you should be aware of, and 1 of them is concerning.
紐曼的投資者度過了艱難的一年,總損失爲0.9%(包括股息),而市場則獲得了約23%的收益。即使是好股票的股價有時也會下跌,但在對基本面指標產生興趣之前,我們希望看到企業基本指標的改善。長期投資者不會感到太沮喪,因爲他們每年可以獲得6%的收益,時間跨度爲五年。如果基本數據繼續表明長期可持續增長,目前的拋售可能值得考慮。我發現長期股價作爲業務表現的一個代理非常有趣。但是爲了真正獲得洞察力,我們還需要考慮其他信息。正如我們看到的,紐曼有兩個警告信號,您需要注意其中1個。
We will like Newmont better if we see some big insider buys. While we wait, check out this free list of undervalued stocks (mostly small caps) with considerable, recent, insider buying.
如果我們看到一些內部人員大筆購買,那麼我們會更喜歡紐曼。在等待的時候,請查看這個免費的低估股票列表(主要是小市值股票),其中有相當多的最近內部人員購買。
Please note, the market returns quoted in this article reflect the market weighted average returns of stocks that currently trade on American exchanges.
請注意,本文所引述的市場回報反映了目前在美國交易所上市的股票的市場加權平均回報。
Have feedback on this article? Concerned about the content? Get in touch with us directly. Alternatively, email editorial-team (at) simplywallst.com.
This article by Simply Wall St is general in nature. We provide commentary based on historical data and analyst forecasts only using an unbiased methodology and our articles are not intended to be financial advice. It does not constitute a recommendation to buy or sell any stock, and does not take account of your objectives, or your financial situation. We aim to bring you long-term focused analysis driven by fundamental data. Note that our analysis may not factor in the latest price-sensitive company announcements or qualitative material. Simply Wall St has no position in any stocks mentioned.
對本文有反饋?關於內容有所顧慮?直接和我們聯繫。或者,發送電子郵件至editorial-team (at) simplywallst.com。
這篇文章是Simply Wall St的一般性文章。我們根據歷史數據和分析師預測提供評論,只使用公正的方法論,我們的文章並不意味着提供任何金融建議。文章不構成買賣任何股票的建議,也不考慮您的目標或您的財務狀況。我們的目標是帶給您基本數據驅動的長期關注分析。請注意,我們的分析可能不考慮最新的價格敏感公司公告或定性材料。Simply Wall St沒有任何股票頭寸。
譯文內容由第三人軟體翻譯。