
Cognex's (NASDAQ:CGNX) Earnings Trajectory Could Turn Positive as the Stock Grows 3.6% This Past Week
Cognex's (NASDAQ:CGNX) Earnings Trajectory Could Turn Positive as the Stock Grows 3.6% This Past Week
In order to justify the effort of selecting individual stocks, it's worth striving to beat the returns from a market index fund. But in any portfolio, there are likely to be some stocks that fall short of that benchmark. We regret to report that long term Cognex Corporation (NASDAQ:CGNX) shareholders have had that experience, with the share price dropping 45% in three years, versus a market return of about 19%. And more recent buyers are having a tough time too, with a drop of 23% in the last year.
爲了證明選擇個別股票的努力是值得的,值得努力打敗市場指數基金所獲得的回報。但在任何投資組合中,可能會有一些股票表現不佳。我們很遺憾地報告說,長揸康耐視公司(納斯達克股票代碼:CGNX)的股東們在這方面已經有了經驗,股價在三年內下跌了45%,而市場回報率約爲19%。最近的買家也遇到了困難,去年下跌了23%。
While the stock has risen 3.6% in the past week but long term shareholders are still in the red, let's see what the fundamentals can tell us.
儘管股份在過去一週上漲了3.6%,但長期股東仍處於虧損狀態,讓我們看看基本面情況。
In his essay The Superinvestors of Graham-and-Doddsville Warren Buffett described how share prices do not always rationally reflect the value of a business. By comparing earnings per share (EPS) and share price changes over time, we can get a feel for how investor attitudes to a company have morphed over time.
在他的文章《格雷厄姆和多德斯維爾超級投資者》中,禾倫·巴菲特描述了股票價格並不總是反映公司價值的合理方式。考慮市場對公司的看法如何發生變化的一個不完美但簡單的方法是將每股收益(EPS)的變化與股價的變動進行比較。股票價格並不總是反映公司價值的合理方式禾倫·巴菲特描述了股票價格並不總是理性反映企業價值的情況。通過比較每股收益(EPS)和股價隨時間的變化,我們可以了解投資者對公司的態度如何隨着時間而變化。
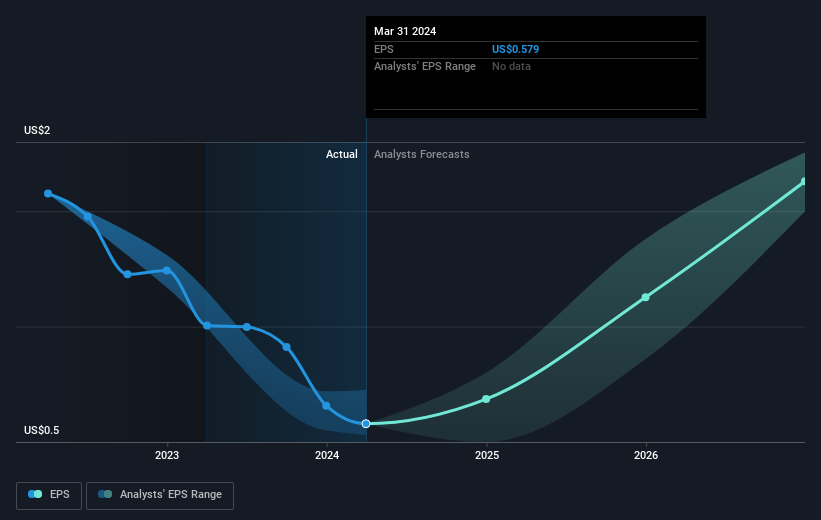
During the three years that the share price fell, Cognex's earnings per share (EPS) dropped by 23% each year. In comparison the 18% compound annual share price decline isn't as bad as the EPS drop-off. So, despite the prior disappointment, shareholders must have some confidence the situation will improve, longer term. This positive sentiment is also reflected in the generous P/E ratio of 75.53.
在股價下跌的三年內,康耐視的每股收益(EPS)每年下降了23%。相比之下,18%的年複合股價下跌並不像EPS下降那麼嚴重。因此,儘管之前讓人失望,股東們必須對長期情況有些信心。這種積極情緒也體現在慷慨的市盈率75.53中。
The image below shows how EPS has tracked over time (if you click on the image you can see greater detail).
下圖顯示了EPS隨時間的變化情況(如果您單擊該圖像,則可以查看更多詳細信息)。
Dive deeper into Cognex's key metrics by checking this interactive graph of Cognex's earnings, revenue and cash flow.
通過查看康耐視收益、營業收入和現金流量的互動圖表來更深入地了解康耐視的關鍵指標。
A Different Perspective
不同的觀點
Investors in Cognex had a tough year, with a total loss of 22% (including dividends), against a market gain of about 23%. However, keep in mind that even the best stocks will sometimes underperform the market over a twelve month period. Longer term investors wouldn't be so upset, since they would have made 0.5%, each year, over five years. If the fundamental data continues to indicate long term sustainable growth, the current sell-off could be an opportunity worth considering. While it is well worth considering the different impacts that market conditions can have on the share price, there are other factors that are even more important. Case in point: We've spotted 1 warning sign for Cognex you should be aware of.
康耐視的投資者在過去一年裏遭受了22%的總損失(包括分紅派息),而市場收益約爲23%。然而,請記住,即使最好的股票有時也會在十二個月的時間內表現不佳。長期投資者不會那麼沮喪,因爲在五年內每年會獲得0.5%的回報。如果基本數據繼續表明長期可持續增長,目前的拋售可能值得考慮。雖然考慮市場條件可能對股價產生的不同影響很重要,但還有其他因素更爲重要。例如,我們發現了康耐視有1個警告信號,您應該注意。
If you are like me, then you will not want to miss this free list of undervalued small caps that insiders are buying.
如果您像我一樣,就不會希望錯過這份免費的內部人士正在購買的低估小市值股票列表。
Please note, the market returns quoted in this article reflect the market weighted average returns of stocks that currently trade on American exchanges.
請注意,本文所引述的市場回報反映了目前在美國交易所上市的股票的市場加權平均回報。
Have feedback on this article? Concerned about the content? Get in touch with us directly. Alternatively, email editorial-team (at) simplywallst.com.
This article by Simply Wall St is general in nature. We provide commentary based on historical data and analyst forecasts only using an unbiased methodology and our articles are not intended to be financial advice. It does not constitute a recommendation to buy or sell any stock, and does not take account of your objectives, or your financial situation. We aim to bring you long-term focused analysis driven by fundamental data. Note that our analysis may not factor in the latest price-sensitive company announcements or qualitative material. Simply Wall St has no position in any stocks mentioned.
對本文有反饋?關於內容有所顧慮?直接和我們聯繫。或者,發送電子郵件至editorial-team (at) simplywallst.com。
這篇文章是Simply Wall St的一般性文章。我們根據歷史數據和分析師預測提供評論,只使用公正的方法論,我們的文章並不意味着提供任何金融建議。文章不構成買賣任何股票的建議,也不考慮您的目標或您的財務狀況。我們的目標是帶給您基本數據驅動的長期關注分析。請注意,我們的分析可能不考慮最新的價格敏感公司公告或定性材料。Simply Wall St沒有任何股票頭寸。
譯文內容由第三人軟體翻譯。