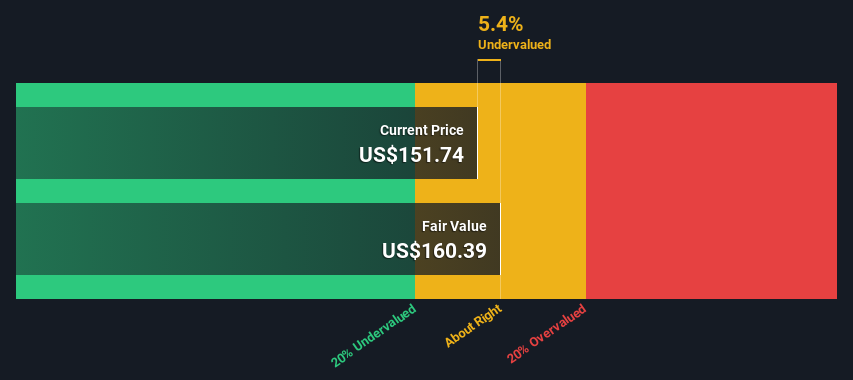
Booz Allen Hamilton Holding's estimated fair value is US$160 based on 2 Stage Free Cash Flow to Equity
Current share price of US$152 suggests Booz Allen Hamilton Holding is potentially trading close to its fair value
Our fair value estimate is 4.0% lower than Booz Allen Hamilton Holding's analyst price target of US$167
Does the June share price for Booz Allen Hamilton Holding Corporation (NYSE:BAH) reflect what it's really worth? Today, we will estimate the stock's intrinsic value by taking the expected future cash flows and discounting them to their present value. This will be done using the Discounted Cash Flow (DCF) model. Believe it or not, it's not too difficult to follow, as you'll see from our example!
Companies can be valued in a lot of ways, so we would point out that a DCF is not perfect for every situation. For those who are keen learners of equity analysis, the Simply Wall St analysis model here may be something of interest to you.
Step By Step Through The Calculation
We use what is known as a 2-stage model, which simply means we have two different periods of growth rates for the company's cash flows. Generally the first stage is higher growth, and the second stage is a lower growth phase. To start off with, we need to estimate the next ten years of cash flows. Where possible we use analyst estimates, but when these aren't available we extrapolate the previous free cash flow (FCF) from the last estimate or reported value. We assume companies with shrinking free cash flow will slow their rate of shrinkage, and that companies with growing free cash flow will see their growth rate slow, over this period. We do this to reflect that growth tends to slow more in the early years than it does in later years.
A DCF is all about the idea that a dollar in the future is less valuable than a dollar today, so we need to discount the sum of these future cash flows to arrive at a present value estimate:
10-year free cash flow (FCF) forecast
2024
2025
2026
2027
2028
2029
2030
2031
2032
2033
Levered FCF ($, Millions)
US$179.2m
US$779.4m
US$905.6m
US$957.5m
US$998.7m
US$1.04b
US$1.07b
US$1.10b
US$1.13b
US$1.16b
Growth Rate Estimate Source
Analyst x6
Analyst x7
Analyst x6
Analyst x2
Est @ 4.31%
Est @ 3.73%
Est @ 3.32%
Est @ 3.04%
Est @ 2.84%
Est @ 2.70%
Present Value ($, Millions) Discounted @ 6.7%
US$168
US$684
US$745
US$739
US$722
US$702
US$680
US$656
US$632
US$609
("Est" = FCF growth rate estimated by Simply Wall St) Present Value of 10-year Cash Flow (PVCF) = US$6.3b
After calculating the present value of future cash flows in the initial 10-year period, we need to calculate the Terminal Value, which accounts for all future cash flows beyond the first stage. For a number of reasons a very conservative growth rate is used that cannot exceed that of a country's GDP growth. In this case we have used the 5-year average of the 10-year government bond yield (2.4%) to estimate future growth. In the same way as with the 10-year 'growth' period, we discount future cash flows to today's value, using a cost of equity of 6.7%.
Present Value of Terminal Value (PVTV)= TV / (1 + r)10= US$28b÷ ( 1 + 6.7%)10= US$14b
The total value, or equity value, is then the sum of the present value of the future cash flows, which in this case is US$21b. To get the intrinsic value per share, we divide this by the total number of shares outstanding. Compared to the current share price of US$152, the company appears about fair value at a 5.4% discount to where the stock price trades currently. Valuations are imprecise instruments though, rather like a telescope - move a few degrees and end up in a different galaxy. Do keep this in mind.
NYSE:BAH Discounted Cash Flow June 10th 2024
The Assumptions
Now the most important inputs to a discounted cash flow are the discount rate, and of course, the actual cash flows. You don't have to agree with these inputs, I recommend redoing the calculations yourself and playing with them. The DCF also does not consider the possible cyclicality of an industry, or a company's future capital requirements, so it does not give a full picture of a company's potential performance. Given that we are looking at Booz Allen Hamilton Holding as potential shareholders, the cost of equity is used as the discount rate, rather than the cost of capital (or weighted average cost of capital, WACC) which accounts for debt. In this calculation we've used 6.7%, which is based on a levered beta of 0.940. Beta is a measure of a stock's volatility, compared to the market as a whole. We get our beta from the industry average beta of globally comparable companies, with an imposed limit between 0.8 and 2.0, which is a reasonable range for a stable business.
SWOT Analysis for Booz Allen Hamilton Holding
Strength
Earnings growth over the past year exceeded the industry.
Debt is well covered by earnings.
Balance sheet summary for BAH.
Weakness
Dividend is low compared to the top 25% of dividend payers in the Professional Services market.
Opportunity
Annual earnings are forecast to grow for the next 3 years.
Current share price is below our estimate of fair value.
Threat
Debt is not well covered by operating cash flow.
Dividends are not covered by cash flow.
Annual earnings are forecast to grow slower than the American market.
Is BAH well equipped to handle threats?
Next Steps:
Valuation is only one side of the coin in terms of building your investment thesis, and it is only one of many factors that you need to assess for a company. The DCF model is not a perfect stock valuation tool. Rather it should be seen as a guide to "what assumptions need to be true for this stock to be under/overvalued?" For instance, if the terminal value growth rate is adjusted slightly, it can dramatically alter the overall result. For Booz Allen Hamilton Holding, we've compiled three further factors you should look at:
Risks: Take risks, for example - Booz Allen Hamilton Holding has 1 warning sign we think you should be aware of.
Future Earnings: How does BAH's growth rate compare to its peers and the wider market? Dig deeper into the analyst consensus number for the upcoming years by interacting with our free analyst growth expectation chart.
Other Solid Businesses: Low debt, high returns on equity and good past performance are fundamental to a strong business. Why not explore our interactive list of stocks with solid business fundamentals to see if there are other companies you may not have considered!
PS. The Simply Wall St app conducts a discounted cash flow valuation for every stock on the NYSE every day. If you want to find the calculation for other stocks just search here.
Have feedback on this article? Concerned about the content?Get in touch with us directly. Alternatively, email editorial-team (at) simplywallst.com. This article by Simply Wall St is general in nature. We provide commentary based on historical data and analyst forecasts only using an unbiased methodology and our articles are not intended to be financial advice. It does not constitute a recommendation to buy or sell any stock, and does not take account of your objectives, or your financial situation. We aim to bring you long-term focused analysis driven by fundamental data. Note that our analysis may not factor in the latest price-sensitive company announcements or qualitative material. Simply Wall St has no position in any stocks mentioned.
主要見解
根據2階段自由現金流到權益法,Booz Allen Hamilton Holding的估值爲160美元。
當前的152美元的股價表明Booz Allen Hamilton Holding的股票已經接近其公允價值。
我們的公允價值估計比Booz Allen Hamilton Holding分析師的目標價167美元低4.0%。
6月份的Booz Allen Hamilton Holding Corporation (紐交所:BAH)的股價是否反映了其真正的價值?今天,我們將通過把未來的現金流折現到現值的方式來估算這隻股票的內在價值,使用的方法是折現現金流(DCF)模型。你將會從我們的實例中了解到,信不信由你,這並不是太難。
現金流折現最重要的輸入因素是折現率,當然還有實際現金流。你不必同意這些輸入,我建議你重新計算並進行調整。DCF模型也不考慮行業的可能週期變動或公司未來的資本需求,因此它不能全面反映公司的潛在業績。考慮到我們正在考慮Booz Allen Hamilton Holding作爲潛在股東,因此使用的是權益成本作爲折現率,而不是資本成本(或加權平均資本成本,WACC),後者考慮了債務因素。在本次計算中,我們使用了6.7%,這是基於0.940的槓桿beta得出的。Beta是衡量一隻股票相對於整個市場波動性的指標。我們從全球可比公司的行業平均beta值中得到我們的beta值,限制範圍在0.8和2.0之間,這是一個穩健業務的合理範圍。
Booz Allen Hamilton Holding SWOT分析
優勢
去年盈利增長超過了行業平均水平。
債務被收益覆蓋良好。
BAH資產負債表摘要。
弱點
與專業服務市場前25%的股息支付者相比,股息較低。
機會
預計未來3年的年度收益將增長。
當前股價低於我們估計的公平價值。
威脅
運營現金流無法很好地覆蓋債務。
股息不被現金流覆蓋。
預計年度收益增長速度將慢於美國市場。
BAH是否準備好應對威脅?
下一步:
在構建您的投資論點方面,估值只是其中的一面,也是您需要評估公司的許多因素之一。DCF模型並不是一種完美的股票估值工具,它應該被視爲一種指導,了解“這隻股票是否被低估/高估所需的假設是什麼?”例如,如果調整終端價值增長率,它可以大大改變整體結果。對於Booz Allen Hamilton Holding,我們編制了另外三個因素,您應該查看:
風險:承擔風險,例如——Booz Allen Hamilton Holding擁有1個警示信號,我們認爲您應該知道。