
Investing in Teledyne Technologies (NYSE:TDY) Five Years Ago Would Have Delivered You a 53% Gain
Investing in Teledyne Technologies (NYSE:TDY) Five Years Ago Would Have Delivered You a 53% Gain
The main point of investing for the long term is to make money. But more than that, you probably want to see it rise more than the market average. Unfortunately for shareholders, while the Teledyne Technologies Incorporated (NYSE:TDY) share price is up 53% in the last five years, that's less than the market return. Unfortunately the share price is down 2.4% in the last year.
長期投資的主要目的是賺錢,但更重要的是,您可能希望看到它的漲幅高於市場平均水平。不幸的是,對於股東來說,Teledyne Technologies Incorporated (NYSE: TDY) 的股價在過去五年中上漲了53%,但低於市場回報率。不幸的是,股價在過去一年中下跌了2.4%。
So let's assess the underlying fundamentals over the last 5 years and see if they've moved in lock-step with shareholder returns.
因此,讓我們評估過去5年的基本面,看看它們是否和股東的回報率相符。
In his essay The Superinvestors of Graham-and-Doddsville Warren Buffett described how share prices do not always rationally reflect the value of a business. By comparing earnings per share (EPS) and share price changes over time, we can get a feel for how investor attitudes to a company have morphed over time.
在他的文章《格雷厄姆和多德斯維爾超級投資者》中,禾倫·巴菲特描述了股票價格並不總是反映公司價值的合理方式。考慮市場對公司的看法如何發生變化的一個不完美但簡單的方法是將每股收益(EPS)的變化與股價的變動進行比較。股票價格並不總是反映公司價值的合理方式禾倫·巴菲特描述了股票價格並不總是理性反映企業價值的情況。通過比較每股收益(EPS)和股價隨時間的變化,我們可以了解投資者對公司的態度如何隨着時間而變化。
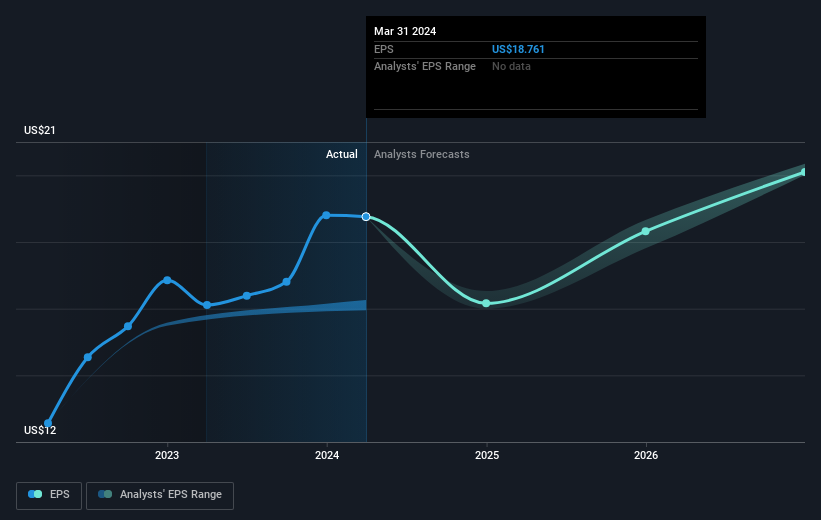
During five years of share price growth, Teledyne Technologies achieved compound earnings per share (EPS) growth of 14% per year. The EPS growth is more impressive than the yearly share price gain of 9% over the same period. So it seems the market isn't so enthusiastic about the stock these days.
在五年的股價上漲中,Teledyne Technologies 每股收益(EPS)年增長率達到14%。EPS的增長比同期9%的年股價增長更令人印象深刻。因此,看起來市場對該股票並不那麼熱情。
The graphic below depicts how EPS has changed over time (unveil the exact values by clicking on the image).
下圖顯示了EPS隨時間變化的情況(點擊圖像以顯示確切值)。
It's probably worth noting that the CEO is paid less than the median at similar sized companies. But while CEO remuneration is always worth checking, the really important question is whether the company can grow earnings going forward. Dive deeper into the earnings by checking this interactive graph of Teledyne Technologies' earnings, revenue and cash flow.
值得注意的是,該公司CEO的薪酬甚至低於同等規模公司的中位數水平。但是,雖然CEO的報酬始終值得檢查,但真正重要的問題是公司是否能增加未來的收益。通過查看 Teledyne Technologies 的收益、營業收入和現金流量的交互式圖表,深入挖掘收益。
A Different Perspective
不同的觀點
While the broader market gained around 25% in the last year, Teledyne Technologies shareholders lost 2.4%. Even the share prices of good stocks drop sometimes, but we want to see improvements in the fundamental metrics of a business, before getting too interested. On the bright side, long term shareholders have made money, with a gain of 9% per year over half a decade. It could be that the recent sell-off is an opportunity, so it may be worth checking the fundamental data for signs of a long term growth trend. Most investors take the time to check the data on insider transactions. You can click here to see if insiders have been buying or selling.
儘管整個市場去年上漲了約25%,Teledyne Technologies 的股東們卻損失了2.4%。即使優質股票的股價有時也會下跌,但我們希望在對業務的基本指標產生改善之前再進行關注。好消息是,長期股東已經賺了錢,在半個十年中年化收益率達到了9%。最近的拋售可能是一個機會,因此檢查基本數據以尋找長期增長趨勢的跡象可能是值得的。大多數投資者都會查看內部交易數據。單擊此處以查看內部人員的買賣情況。
But note: Teledyne Technologies may not be the best stock to buy. So take a peek at this free list of interesting companies with past earnings growth (and further growth forecast).
但請注意:Teledyne Technologies 可能不是最好的股票。因此,可以看看這個免費的有過去盈利增長的有趣公司名單(以及更多的增長預測)。
Please note, the market returns quoted in this article reflect the market weighted average returns of stocks that currently trade on American exchanges.
請注意,本文所引述的市場回報反映了目前在美國交易所上市的股票的市場加權平均回報。
Have feedback on this article? Concerned about the content? Get in touch with us directly. Alternatively, email editorial-team (at) simplywallst.com.
This article by Simply Wall St is general in nature. We provide commentary based on historical data and analyst forecasts only using an unbiased methodology and our articles are not intended to be financial advice. It does not constitute a recommendation to buy or sell any stock, and does not take account of your objectives, or your financial situation. We aim to bring you long-term focused analysis driven by fundamental data. Note that our analysis may not factor in the latest price-sensitive company announcements or qualitative material. Simply Wall St has no position in any stocks mentioned.
對本文有反饋?關於內容有所顧慮?直接和我們聯繫。或者,發送電子郵件至editorial-team (at) simplywallst.com。
這篇文章是Simply Wall St的一般性文章。我們根據歷史數據和分析師預測提供評論,只使用公正的方法論,我們的文章並不意味着提供任何金融建議。文章不構成買賣任何股票的建議,也不考慮您的目標或您的財務狀況。我們的目標是帶給您基本數據驅動的長期關注分析。請注意,我們的分析可能不考慮最新的價格敏感公司公告或定性材料。Simply Wall St沒有任何股票頭寸。
譯文內容由第三人軟體翻譯。