
XPO's (NYSE:XPO) One-year Earnings Growth Trails the Strong Shareholder Returns
XPO's (NYSE:XPO) One-year Earnings Growth Trails the Strong Shareholder Returns
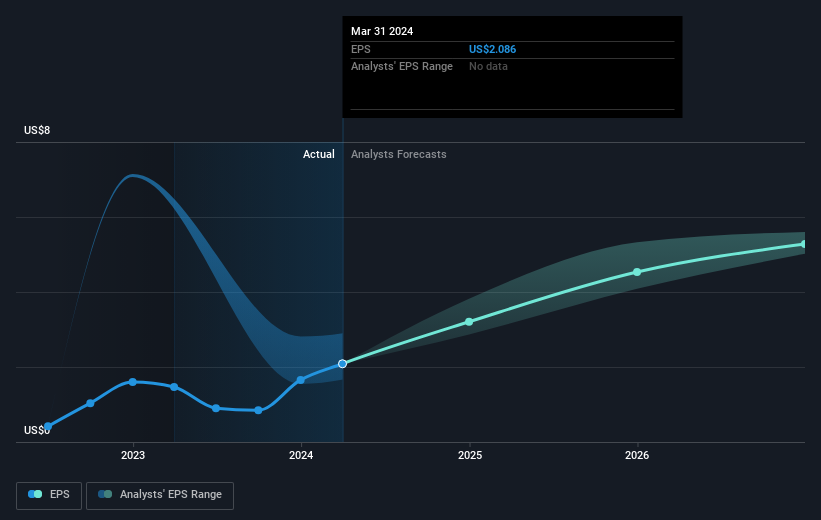
 XPO was able to grow EPS by 42% in the last twelve months. This EPS growth is significantly lower than the 128% increase in the share price. This indicates that the market is now more optimistic about the stock. This favorable sentiment is reflected in its (fairly optimistic) P/E ratio of 52.64.
 It hasn't been the best quarter for XPO, Inc. (NYSE:XPO) shareholders, since the share price has fallen 12% in that time. Despite this, the stock is a strong performer over the last year, no doubt about that. Indeed, the share price is up an impressive 128% in that time. So some might not be surprised to see the price retrace some. Investors should be wondering whether the business itself has the fundamental value required to continue to drive gains.
紐交所:XPO的股東度過了不太好的一季度,因爲在這段時間裏,股價下跌了12%。然而,股票在過去一年中表現強勁,毫無疑問。的確,股價在這段時間內上漲了驚人的128%。因此,一些人可能不會驚訝地看到價格回調。投資者應該想知道業務本身是否具有推動收益增長所需的基本價值。
Since the stock has added US$829m to its market cap in the past week alone, let's see if underlying performance has been driving long-term returns.
由於該股上週市值增加了8.29億美元,讓我們看看基本面表現是否推動了長期回報。
While markets are a powerful pricing mechanism, share prices reflect investor sentiment, not just underlying business performance. One flawed but reasonable way to assess how sentiment around a company has changed is to compare the earnings per share (EPS) with the share price.
雖然市場是一個強大的定價機制,但股價反映了投資者情緒,不僅僅是基本業績。一種有缺陷但合理的評估公司周圍情緒如何變化的方法是將每股收益(EPS)與股價進行比較。
XPO was able to grow EPS by 42% in the last twelve months. This EPS growth is significantly lower than the 128% increase in the share price. This indicates that the market is now more optimistic about the stock. This favorable sentiment is reflected in its (fairly optimistic) P/E ratio of 52.64.
XPO能夠在過去的十二個月內將每股收益增長42%。這種EPS增長顯著低於股價上漲的128%。這表明市場現在對股票更爲樂觀。這種積極的情緒體現在其(相當樂觀)的市盈率爲52.64上。
The graphic below depicts how EPS has changed over time (unveil the exact values by clicking on the image).
下圖顯示了EPS隨時間變化的情況(點擊圖像以顯示確切值)。
We consider it positive that insiders have made significant purchases in the last year. Having said that, most people consider earnings and revenue growth trends to be a more meaningful guide to the business. Dive deeper into the earnings by checking this interactive graph of XPO's earnings, revenue and cash flow.
我們認爲內部人士在過去一年中進行了重大購買是積極的。即便如此,大多數人認爲收益和營收增長趨勢是業務更有意義的指導。通過查看XPO的收益、營收和現金流的互動圖表來深入了解收益情況。
A Different Perspective
不同的觀點
It's good to see that XPO has rewarded shareholders with a total shareholder return of 128% in the last twelve months. That gain is better than the annual TSR over five years, which is 42%. Therefore it seems like sentiment around the company has been positive lately. In the best case scenario, this may hint at some real business momentum, implying that now could be a great time to delve deeper. I find it very interesting to look at share price over the long term as a proxy for business performance. But to truly gain insight, we need to consider other information, too. For example, we've discovered 2 warning signs for XPO (1 is concerning!) that you should be aware of before investing here.
很高興看到XPO在過去的十二個月中以總股東回報率128%回報了股東。這一增長優於五年期間的年度TSR,爲42%。因此,近期公司的情緒似乎是積極的。在最好的情況下,這可能暗示了一些真正的業務動力,這意味着現在可能是深入挖掘的好時機。我認爲長期股價作爲業務表現的代理非常有趣。但是,要真正獲得洞察力,我們還需要考慮其他信息。例如,我們已發現XPO的2個警告信號(其中1個是令人關注!)需要您在投資這裏之前了解。
XPO is not the only stock insiders are buying. So take a peek at this free list of small cap companies at attractive valuations which insiders have been buying.
XPO並不是內部人士正在購買的唯一股票。因此,看看這個免費的小盤公司收購清單,這些公司以有吸引力的估值吸引了內部人士的購買。
Please note, the market returns quoted in this article reflect the market weighted average returns of stocks that currently trade on American exchanges.
請注意,本文所引述的市場回報反映了目前在美國交易所上市的股票的市場加權平均回報。
Have feedback on this article? Concerned about the content? Get in touch with us directly. Alternatively, email editorial-team (at) simplywallst.com.
This article by Simply Wall St is general in nature. We provide commentary based on historical data and analyst forecasts only using an unbiased methodology and our articles are not intended to be financial advice. It does not constitute a recommendation to buy or sell any stock, and does not take account of your objectives, or your financial situation. We aim to bring you long-term focused analysis driven by fundamental data. Note that our analysis may not factor in the latest price-sensitive company announcements or qualitative material. Simply Wall St has no position in any stocks mentioned.
對本文有反饋?關於內容有所顧慮?直接和我們聯繫。或者,發送電子郵件至editorial-team (at) simplywallst.com。
這篇文章是Simply Wall St的一般性文章。我們根據歷史數據和分析師預測提供評論,只使用公正的方法論,我們的文章並不意味着提供任何金融建議。文章不構成買賣任何股票的建議,也不考慮您的目標或您的財務狀況。我們的目標是帶給您基本數據驅動的長期關注分析。請注意,我們的分析可能不考慮最新的價格敏感公司公告或定性材料。Simply Wall St沒有任何股票頭寸。
譯文內容由第三人軟體翻譯。