
Investors Five-year Losses Continue as PROG Holdings (NYSE:PRG) Dips a Further 5.7% This Week, Earnings Continue to Decline
Investors Five-year Losses Continue as PROG Holdings (NYSE:PRG) Dips a Further 5.7% This Week, Earnings Continue to Decline
PROG Holdings, Inc. (NYSE:PRG) shareholders should be happy to see the share price up 12% in the last quarter. But that doesn't change the fact that the returns over the last five years have been less than pleasing. You would have done a lot better buying an index fund, since the stock has dropped 41% in that half decade.
紐交所的PROG Holdings股東應該很高興看到股價在上個季度上漲了12%。但事實上,過去五年的回報卻不盡如人意。由於這隻股票在這五年中下跌了41%,如果你購買了一隻指數基金,你的收益會更好。
If the past week is anything to go by, investor sentiment for PROG Holdings isn't positive, so let's see if there's a mismatch between fundamentals and the share price.
如果過去一週是參考的話,對PROG Holdings的投資者情緒並不樂觀。因此,讓我們看看基本面和股價之間是否存在錯配。
There is no denying that markets are sometimes efficient, but prices do not always reflect underlying business performance. One imperfect but simple way to consider how the market perception of a company has shifted is to compare the change in the earnings per share (EPS) with the share price movement.
不可否認的是,市場有時是高效的,但價格並不總是反映潛在的商業表現。一個不完美但簡單的方法來考慮公司市場感知如何改變是比較每股收益(EPS)變化和股價變動。
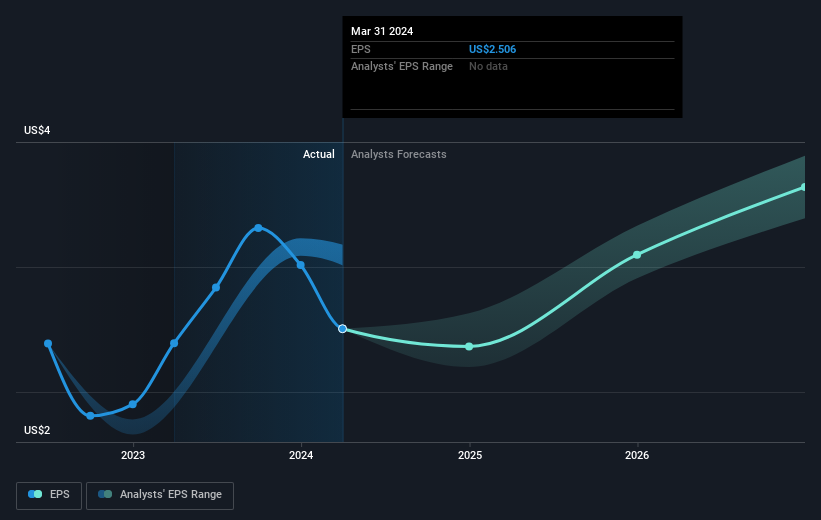
During the five years over which the share price declined, PROG Holdings' earnings per share (EPS) dropped by 2.2% each year. Readers should note that the share price has fallen faster than the EPS, at a rate of 10% per year, over the period. This implies that the market was previously too optimistic about the stock.
在股價下跌的五年內,PROG Holdings的每股收益每年下降了2.2%。但讀者應該注意到,股價在此期間下跌的速度比每股收益快,達到每年10%。這意味着市場先前對股票過於樂觀。
You can see how EPS has changed over time in the image below (click on the chart to see the exact values).
您可以在下面的圖片中查看每股收益如何隨時間變化(單擊圖表以查看確切的價值)。
Before buying or selling a stock, we always recommend a close examination of historic growth trends, available here.
在購買或出售股票之前,我們始終建議仔細研究歷史增長趨勢,此處提供。
What About Dividends?
那麼分紅怎麼樣呢?
As well as measuring the share price return, investors should also consider the total shareholder return (TSR). The TSR incorporates the value of any spin-offs or discounted capital raisings, along with any dividends, based on the assumption that the dividends are reinvested. So for companies that pay a generous dividend, the TSR is often a lot higher than the share price return. In the case of PROG Holdings, it has a TSR of -30% for the last 5 years. That exceeds its share price return that we previously mentioned. This is largely a result of its dividend payments!
除了測量股價回報率,投資者還應考慮股東的總回報率(TSR)。TSR包括任何分拆或折價的融資價值,以及任何股息,基於股息再投資的假設。因此對於那些支付豐厚股息的公司,TSR往往要高得多。在PROG Holdings的情況下,過去5年TSR爲-30%,超過了我們之前提到的股價回報率。這在很大程度上是其股息支付的結果!
A Different Perspective
不同的觀點
PROG Holdings shareholders gained a total return of 5.4% during the year. But that return falls short of the market. But at least that's still a gain! Over five years the TSR has been a reduction of 5% per year, over five years. It could well be that the business is stabilizing. It's always interesting to track share price performance over the longer term. But to understand PROG Holdings better, we need to consider many other factors. Case in point: We've spotted 2 warning signs for PROG Holdings you should be aware of.
PROG Holdings的股東在這一年中總共獲得了5.4%的回報。但這一回報仍然低於市場。但至少這還是有回報的!在過去五年中,TSR每年降低5%。也許這個公司正在穩定。長期跟蹤股價表現總是很有趣的。但要更好地了解PROG Holdings,我們需要考慮許多其他因素。可以看出,我們已經發現了PROG Holdings的2個警告信號,你應該注意。
Of course, you might find a fantastic investment by looking elsewhere. So take a peek at this free list of companies we expect will grow earnings.
當然,您可能在其他地方找到一家出色的企業進行投資。因此,請查看我們預計將實現盈利增長的公司的免費列表。
Please note, the market returns quoted in this article reflect the market weighted average returns of stocks that currently trade on American exchanges.
請注意,本文所引述的市場回報反映了目前在美國交易所上市的股票的市場加權平均回報。
Have feedback on this article? Concerned about the content? Get in touch with us directly. Alternatively, email editorial-team (at) simplywallst.com.
This article by Simply Wall St is general in nature. We provide commentary based on historical data and analyst forecasts only using an unbiased methodology and our articles are not intended to be financial advice. It does not constitute a recommendation to buy or sell any stock, and does not take account of your objectives, or your financial situation. We aim to bring you long-term focused analysis driven by fundamental data. Note that our analysis may not factor in the latest price-sensitive company announcements or qualitative material. Simply Wall St has no position in any stocks mentioned.
對本文有反饋?關於內容有所顧慮?直接和我們聯繫。或者,發送電子郵件至editorial-team (at) simplywallst.com。
這篇文章是Simply Wall St的一般性文章。我們根據歷史數據和分析師預測提供評論,只使用公正的方法論,我們的文章並不意味着提供任何金融建議。文章不構成買賣任何股票的建議,也不考慮您的目標或您的財務狀況。我們的目標是帶給您基本數據驅動的長期關注分析。請注意,我們的分析可能不考慮最新的價格敏感公司公告或定性材料。Simply Wall St沒有任何股票頭寸。
譯文內容由第三人軟體翻譯。