
Is GrafTech International (NYSE:EAF) Using Too Much Debt?
Is GrafTech International (NYSE:EAF) Using Too Much Debt?
Howard Marks put it nicely when he said that, rather than worrying about share price volatility, 'The possibility of permanent loss is the risk I worry about... and every practical investor I know worries about.' It's only natural to consider a company's balance sheet when you examine how risky it is, since debt is often involved when a business collapses. Importantly, GrafTech International Ltd. (NYSE:EAF) does carry debt. But the real question is whether this debt is making the company risky.
霍華德·馬克思說得好:“與其擔心股價波動,我擔心的是… 永久性損失的可能性; 我所認識的每個實際投資者都很擔心它。” 當你考慮一個公司的風險時,考慮到公司的資產負債表是很自然的,因爲債務往往與企業崩潰有關。重點是,GrafTech International Ltd.(紐交所:EAF)確實負債。但真正的問題是,這些債務是否使公司具有風險。
When Is Debt Dangerous?
債務何時有危險?
Debt is a tool to help businesses grow, but if a business is incapable of paying off its lenders, then it exists at their mercy. In the worst case scenario, a company can go bankrupt if it cannot pay its creditors. However, a more frequent (but still costly) occurrence is where a company must issue shares at bargain-basement prices, permanently diluting shareholders, just to shore up its balance sheet. Of course, plenty of companies use debt to fund growth, without any negative consequences. The first step when considering a company's debt levels is to consider its cash and debt together.
債務是幫助企業增長的工具,但如果業務不能償還債權人的債務,則企業將處於其債權人的掌控下。在最壞的情況下,企業無法償付債權人的債務時會破產。但是,更爲頻繁(但仍然代價高昂)的情況是,公司必須以低廉的價格發行股票,永久性稀釋股東,以支撐其資產負債表。當然,許多公司使用債務來資助增長,沒有任何負面後果。考慮公司的債務水平的第一步是考慮其現金和債務的總和。
What Is GrafTech International's Net Debt?
GrafTech International的淨債務是多少?
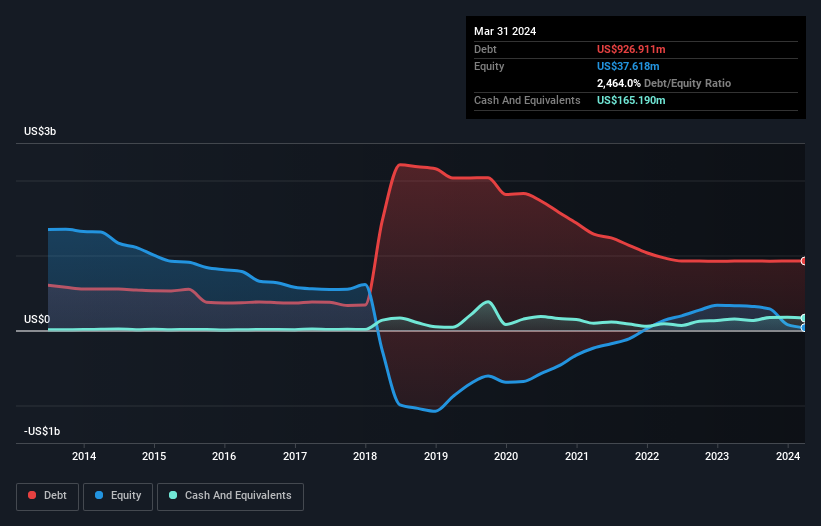
As you can see below, GrafTech International had US$926.9m of debt, at March 2024, which is about the same as the year before. You can click the chart for greater detail. On the flip side, it has US$165.2m in cash leading to net debt of about US$761.7m.
從下面的圖表可以看出,截至2024年3月,GrafTech International的債務爲9.269億美元,與前一年大致相同。您可以單擊圖表以獲取更多詳細信息。另一方面,它有1.652億美元的現金,導致淨債務約爲7.617億美元。
A Look At GrafTech International's Liabilities
GrafTech International的負債
Zooming in on the latest balance sheet data, we can see that GrafTech International had liabilities of US$166.4m due within 12 months and liabilities of US$1.01b due beyond that. Offsetting this, it had US$165.2m in cash and US$91.6m in receivables that were due within 12 months. So its liabilities outweigh the sum of its cash and (near-term) receivables by US$921.5m.
這個缺口讓這家360億美元的公司蒙上了一層陰影,就像高聳在凡人之上的巨人一樣。因此,我們肯定認爲股東需要密切關注這一點。畢竟,如果GrafTech International今天必須償付其債權人,那麼它可能需要大規模的重新資本化。毫無疑問,我們從資產負債表中了解到大多數關於債務的內容。但最終,將決定GrafTech International能否保持健康的資產負債表的是未來的盈利情況。因此,如果您想看看專業人士的想法,您可能會發現此免費的關於分析師利潤預測的報告很有趣。
This deficit casts a shadow over the US$360.0m company, like a colossus towering over mere mortals. So we definitely think shareholders need to watch this one closely. After all, GrafTech International would likely require a major re-capitalisation if it had to pay its creditors today. There's no doubt that we learn most about debt from the balance sheet. But it is future earnings, more than anything, that will determine GrafTech International's ability to maintain a healthy balance sheet going forward. So if you want to see what the professionals think, you might find this free report on analyst profit forecasts to be interesting.
在過去的12個月中,GrafTech International在EBIT水平上虧損,並將其營業收入下降到了6.18億美元,下降了41%。坦率地說,這並不好。
Over 12 months, GrafTech International made a loss at the EBIT level, and saw its revenue drop to US$618m, which is a fall of 41%. To be frank that doesn't bode well.
GrafTech International的營收和息稅前利潤(Ebit)在過去的12個月中都出現了負增長。截至目前,公司營業收入下降了41%,Ebit爲-6,500萬美元。這些都與我們之前提到的顯著負債情況相結合,使得我們對該股產生了非常大的疑慮。當然,它可能會通過一些運氣和良好的執行來改善其情況。但我們認爲這是不可能的,因爲它的流動資產不足,並且在過去一年中已經虧損了2.79億美元。因此,雖然假設公司會失敗並不明智,但我們確實認爲這很有風險。當您分析債務時,資產負債表顯然是需要關注的領域。但是,每家公司都可能存在不在資產負債表之外的風險。
Caveat Emptor
買方自負。
Not only did GrafTech International's revenue slip over the last twelve months, but it also produced negative earnings before interest and tax (EBIT). Indeed, it lost a very considerable US$65m at the EBIT level. Combining this information with the significant liabilities we already touched on makes us very hesitant about this stock, to say the least. Of course, it may be able to improve its situation with a bit of luck and good execution. But we think that is unlikely since it is low on liquid assets, and made a loss of US$279m in the last year. So while it's not wise to assume the company will fail, we do think it's risky. The balance sheet is clearly the area to focus on when you are analysing debt. But ultimately, every company can contain risks that exist outside of the balance sheet. We've identified 2 warning signs with GrafTech International (at least 1 which doesn't sit too well with us) , and understanding them should be part of your investment process.
GrafTech International的營收和息稅前利潤(Ebit)在過去的12個月中都出現了負增長。截至目前,公司營業收入下降了41%,Ebit爲-6,500萬美元。這些都與我們之前提到的顯著負債情況相結合,使得我們對該股產生了非常大的疑慮。當然,它可能會通過一些運氣和良好的執行來改善其情況。但我們認爲這是不可能的,因爲它的流動資產不足,並且在過去一年中已經虧損了2.79億美元。因此,雖然假設公司會失敗並不明智,但我們確實認爲這很有風險。當您分析債務時,資產負債表顯然是需要關注的領域。但是,每家公司都可能存在不在資產負債表之外的風險。我們已經確定了2個警告信號,其中至少有1個對我們來說並不太好,請在投資過程中注意。如果您想獲取更多有關GrafTech International的信息,請點擊此處以獲取分析師利潤預測的免費報告。
At the end of the day, it's often better to focus on companies that are free from net debt. You can access our special list of such companies (all with a track record of profit growth). It's free.
總的來說,專注於沒有淨債務的公司往往更好。您可以訪問我們的特別列表,其中包含這些公司(所有這些公司都有盈利增長的記錄)。這是免費的。
Have feedback on this article? Concerned about the content? Get in touch with us directly. Alternatively, email editorial-team (at) simplywallst.com.
This article by Simply Wall St is general in nature. We provide commentary based on historical data and analyst forecasts only using an unbiased methodology and our articles are not intended to be financial advice. It does not constitute a recommendation to buy or sell any stock, and does not take account of your objectives, or your financial situation. We aim to bring you long-term focused analysis driven by fundamental data. Note that our analysis may not factor in the latest price-sensitive company announcements or qualitative material. Simply Wall St has no position in any stocks mentioned.
對本文有反饋?關於內容有所顧慮?直接和我們聯繫。或者,發送電子郵件至editorial-team (at) simplywallst.com。
這篇文章是Simply Wall St的一般性文章。我們根據歷史數據和分析師預測提供評論,只使用公正的方法論,我們的文章並不意味着提供任何金融建議。文章不構成買賣任何股票的建議,也不考慮您的目標或您的財務狀況。我們的目標是帶給您基本數據驅動的長期關注分析。請注意,我們的分析可能不考慮最新的價格敏感公司公告或定性材料。Simply Wall St沒有任何股票頭寸。
譯文內容由第三人軟體翻譯。