
Charles River Laboratories International (NYSE:CRL) Stock Performs Better Than Its Underlying Earnings Growth Over Last Five Years
Charles River Laboratories International (NYSE:CRL) Stock Performs Better Than Its Underlying Earnings Growth Over Last Five Years
It hasn't been the best quarter for Charles River Laboratories International, Inc. (NYSE:CRL) shareholders, since the share price has fallen 17% in that time. But at least the stock is up over the last five years. Unfortunately its return of 68% is below the market return of 97%. While the returns over the last 5 years have been good, we do feel sorry for those shareholders who haven't held shares that long, because the share price is down 38% in the last three years.
對於Charles River Laboratories International, Inc. (NYSE:CRL)的股東來說,這一季度不是最好的時期,因爲股價在那段時間裏下跌了17%。但至少過去五年股票價格有上漲。不幸的是,它的回報率達到了68%,低於市場回報率97%。雖然過去5年的回報很好,但我們確實爲那些沒有持有股票那麼長時間的股東感到遺憾,因爲股價在過去的三年中下跌了38%。
The past week has proven to be lucrative for Charles River Laboratories International investors, so let's see if fundamentals drove the company's five-year performance.
在過去的一週中,Charles River Laboratories International的投資者獲得了可觀的回報,因此讓我們看看基本面是否推動了該公司的5年表現。
While the efficient markets hypothesis continues to be taught by some, it has been proven that markets are over-reactive dynamic systems, and investors are not always rational. One imperfect but simple way to consider how the market perception of a company has shifted is to compare the change in the earnings per share (EPS) with the share price movement.
雖然一些人仍然相信有效市場假說,但已經證明市場是過度反應的動態系統,投資者並不總是理性的。一個不完美但簡單的方法來考慮公司市場看法的變化是比較每股收益(EPS)的變化和股價的波動。
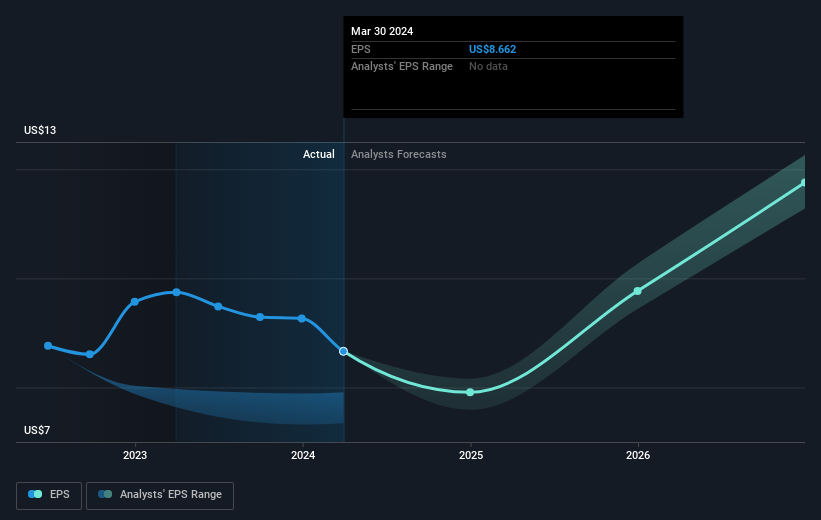
During five years of share price growth, Charles River Laboratories International achieved compound earnings per share (EPS) growth of 13% per year. This EPS growth is reasonably close to the 11% average annual increase in the share price. That suggests that the market sentiment around the company hasn't changed much over that time. Indeed, it would appear the share price is reacting to the EPS.
在股價增長的五年裏,查爾斯河實驗室國際公司實現了每股收益(EPS)複合增長率爲13%。這種EPS增長率與股價年均11%的增長率相當接近。這表明市場對該公司的情緒在那個時候沒有發生太大變化。事實上,股價似乎是在反應EPS。
You can see below how EPS has changed over time (discover the exact values by clicking on the image).
下面可以看到每股收益隨時間的變化情況(通過點擊圖像來查看確切數值)。
We consider it positive that insiders have made significant purchases in the last year. Even so, future earnings will be far more important to whether current shareholders make money. Before buying or selling a stock, we always recommend a close examination of historic growth trends, available here..
考慮到任何給定股票的總股東回報率以及股價回報率是非常重要的。 TSR包括根據紅利再投資的假設,基於任何分拆或折價募集資本的價值,以及任何股息。可以說,TSR提供了有關股票產生的回報的更全面的畫面。在MillerKnoll的情況下,其在最近的1年中具有90%的TSR。這超過了我們之前提到的股價回報。可以毫不費力地猜到,股息支付在很大程度上解釋了這種分歧!
A Different Perspective
不同的觀點
Charles River Laboratories International shareholders are up 9.1% for the year. But that was short of the market average. If we look back over five years, the returns are even better, coming in at 11% per year for five years. It's quite possible the business continues to execute with prowess, even as the share price gains are slowing. While it is well worth considering the different impacts that market conditions can have on the share price, there are other factors that are even more important. To that end, you should be aware of the 1 warning sign we've spotted with Charles River Laboratories International .
查爾斯河實驗室國際公司的股東今年的回報率爲9.1%。但這還不及市場平均水平。如果我們回顧五年,回報率甚至更好,五年的年回報率達到11%。業務很可能繼續發揮優勢,即使股價增長正在放緩。儘管考慮市場條件對股價的影響具有很大的價值,但是還有其他更重要的因素。因此,您應該注意我們發現的1個有關Charles River Laboratories International的警告信號。
Charles River Laboratories International is not the only stock that insiders are buying. For those who like to find lesser know companies this free list of growing companies with recent insider purchasing, could be just the ticket.
查爾斯河實驗室國際公司不是唯一一家內部人員正在購買股票的公司。對於那些想要尋找不太知名的公司的人,這個由最近有內部人員購買的成長公司的免費列表可能是個好選擇。
Please note, the market returns quoted in this article reflect the market weighted average returns of stocks that currently trade on American exchanges.
請注意,本文所引述的市場回報反映了目前在美國交易所上市的股票的市場加權平均回報。
Have feedback on this article? Concerned about the content? Get in touch with us directly. Alternatively, email editorial-team (at) simplywallst.com.
This article by Simply Wall St is general in nature. We provide commentary based on historical data and analyst forecasts only using an unbiased methodology and our articles are not intended to be financial advice. It does not constitute a recommendation to buy or sell any stock, and does not take account of your objectives, or your financial situation. We aim to bring you long-term focused analysis driven by fundamental data. Note that our analysis may not factor in the latest price-sensitive company announcements or qualitative material. Simply Wall St has no position in any stocks mentioned.
對本文有反饋?關於內容有所顧慮?直接和我們聯繫。或者,發送電子郵件至editorial-team (at) simplywallst.com。
這篇文章是Simply Wall St的一般性文章。我們根據歷史數據和分析師預測提供評論,只使用公正的方法論,我們的文章並不意味着提供任何金融建議。文章不構成買賣任何股票的建議,也不考慮您的目標或您的財務狀況。我們的目標是帶給您基本數據驅動的長期關注分析。請注意,我們的分析可能不考慮最新的價格敏感公司公告或定性材料。Simply Wall St沒有任何股票頭寸。
譯文內容由第三人軟體翻譯。