
Further Weakness as NLIGHT (NASDAQ:LASR) Drops 8.4% This Week, Taking Three-year Losses to 57%
Further Weakness as NLIGHT (NASDAQ:LASR) Drops 8.4% This Week, Taking Three-year Losses to 57%
The truth is that if you invest for long enough, you're going to end up with some losing stocks. But the long term shareholders of nLIGHT, Inc. (NASDAQ:LASR) have had an unfortunate run in the last three years. Sadly for them, the share price is down 57% in that time. On top of that, the share price is down 8.4% in the last week.
事實是,如果你長期投資,你最終會擁有一些賠錢的股票。然而,nlight公司(納斯達克:LASR)的長期股東在過去的三年裏運氣不太好。不幸的是,股價在此期間下跌了57%。除此之外,股價在上週下跌了8.4%。
If the past week is anything to go by, investor sentiment for nLIGHT isn't positive, so let's see if there's a mismatch between fundamentals and the share price.
如果過去一週有什麼體現,那麼nlight的投資者情緒並不積極,讓我們看看基本面和股價之間是否有不匹配。
nLIGHT wasn't profitable in the last twelve months, it is unlikely we'll see a strong correlation between its share price and its earnings per share (EPS). Arguably revenue is our next best option. Generally speaking, companies without profits are expected to grow revenue every year, and at a good clip. As you can imagine, fast revenue growth, when maintained, often leads to fast profit growth.
過去十二個月nlight沒有盈利,它的股價和每股收益(EPS)之間很可能沒有強相關性。可以說,我們下一個最佳選擇是營業收入。一般來說,沒有利潤的公司預期每年都會快速增長營業收入。當然,快速的營收增長,如果保持,往往會導致快速的利潤增長。
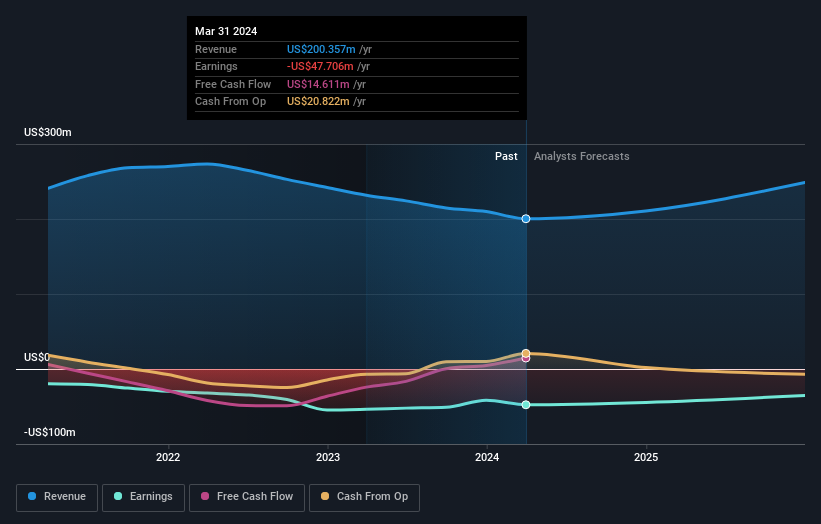
Over the last three years, nLIGHT's revenue dropped 8.5% per year. That's not what investors generally want to see. With revenue in decline, and profit but a dream, we can understand why the share price has been declining at 16% per year. Of course, it's the future that will determine whether today's price is a good one. We'd be pretty wary of this one until it makes a profit, because we don't specialize in finding turnaround situations.
在過去的三年裏,nlight的營業收入每年下降8.5%。這不是投資者通常希望看到的。隨着營業收入下降,而利潤只是一個夢想,我們可以理解爲什麼股價每年下跌16%。當然,未來將決定今天的價格是否合理。在它實現盈利之前,我們對這個股票會非常謹慎,因爲我們不擅長尋找扭虧爲盈的情況。
The image below shows how earnings and revenue have tracked over time (if you click on the image you can see greater detail).
下圖顯示了收益和營收隨時間變化的情況(如果你點擊圖像,可以看到更多細節):
Balance sheet strength is crucial. It might be well worthwhile taking a look at our free report on how its financial position has changed over time.
資產負債表強度至關重要。查看我們關於其財務狀況如何隨時間變化的免費報告可能很值得一看。
A Different Perspective
不同的觀點
Investors in nLIGHT had a tough year, with a total loss of 18%, against a market gain of about 25%. Even the share prices of good stocks drop sometimes, but we want to see improvements in the fundamental metrics of a business, before getting too interested. Unfortunately, last year's performance may indicate unresolved challenges, given that it was worse than the annualised loss of 6% over the last half decade. Generally speaking long term share price weakness can be a bad sign, though contrarian investors might want to research the stock in hope of a turnaround. It's always interesting to track share price performance over the longer term. But to understand nLIGHT better, we need to consider many other factors. For example, we've discovered 2 warning signs for nLIGHT that you should be aware of before investing here.
nlight的投資者度過了艱難的一年,總損失達到了18%,而市場收益約爲25%。即使優質股票的股價有時也會下跌,但我們想看到該企業的基本指標有所改善,然後再對其產生興趣。不幸的是,去年的表現可能表明尚未解決的挑戰,因爲它比過去五年的年化虧損6%還要糟糕。一般來說,長期股價疲軟可能是個不好的跡象,儘管與衆不同的投資者可能想調查該股票的希望逆轉。跟蹤股價長期表現總是很有趣的,但要更好地了解nlight,我們需要考慮許多其他因素。例如,我們已經發現nlight的2個預警信號,在此之前,在投資這裏時應該注意。
If you are like me, then you will not want to miss this free list of undervalued small caps that insiders are buying.
如果您像我一樣,就不會希望錯過這份免費的內部人士正在購買的低估小市值股票列表。
Please note, the market returns quoted in this article reflect the market weighted average returns of stocks that currently trade on American exchanges.
請注意,本文所引述的市場回報反映了目前在美國交易所上市的股票的市場加權平均回報。
Have feedback on this article? Concerned about the content? Get in touch with us directly. Alternatively, email editorial-team (at) simplywallst.com.
This article by Simply Wall St is general in nature. We provide commentary based on historical data and analyst forecasts only using an unbiased methodology and our articles are not intended to be financial advice. It does not constitute a recommendation to buy or sell any stock, and does not take account of your objectives, or your financial situation. We aim to bring you long-term focused analysis driven by fundamental data. Note that our analysis may not factor in the latest price-sensitive company announcements or qualitative material. Simply Wall St has no position in any stocks mentioned.
對本文有反饋?關於內容有所顧慮?直接和我們聯繫。或者,發送電子郵件至editorial-team (at) simplywallst.com。
這篇文章是Simply Wall St的一般性文章。我們根據歷史數據和分析師預測提供評論,只使用公正的方法論,我們的文章並不意味着提供任何金融建議。文章不構成買賣任何股票的建議,也不考慮您的目標或您的財務狀況。我們的目標是帶給您基本數據驅動的長期關注分析。請注意,我們的分析可能不考慮最新的價格敏感公司公告或定性材料。Simply Wall St沒有任何股票頭寸。
譯文內容由第三人軟體翻譯。