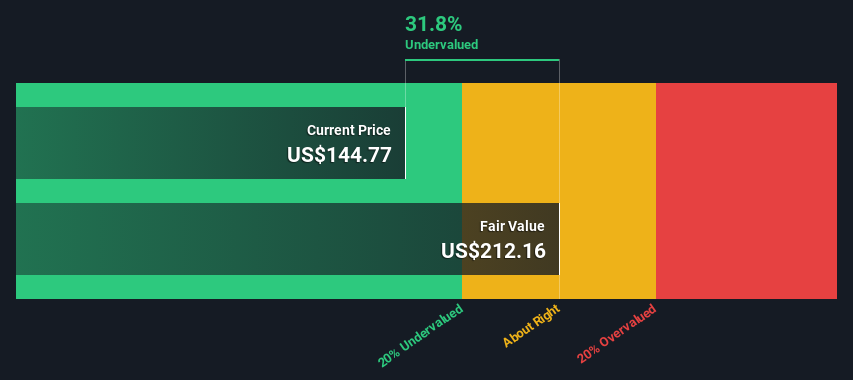
Using the 2 Stage Free Cash Flow to Equity, Genuine Parts fair value estimate is US$212
Genuine Parts' US$145 share price signals that it might be 32% undervalued
The US$168 analyst price target for GPC is 21% less than our estimate of fair value
How far off is Genuine Parts Company (NYSE:GPC) from its intrinsic value? Using the most recent financial data, we'll take a look at whether the stock is fairly priced by taking the expected future cash flows and discounting them to their present value. Our analysis will employ the Discounted Cash Flow (DCF) model. Believe it or not, it's not too difficult to follow, as you'll see from our example!
We would caution that there are many ways of valuing a company and, like the DCF, each technique has advantages and disadvantages in certain scenarios. Anyone interested in learning a bit more about intrinsic value should have a read of the Simply Wall St analysis model.
The Method
We're using the 2-stage growth model, which simply means we take in account two stages of company's growth. In the initial period the company may have a higher growth rate and the second stage is usually assumed to have a stable growth rate. To begin with, we have to get estimates of the next ten years of cash flows. Where possible we use analyst estimates, but when these aren't available we extrapolate the previous free cash flow (FCF) from the last estimate or reported value. We assume companies with shrinking free cash flow will slow their rate of shrinkage, and that companies with growing free cash flow will see their growth rate slow, over this period. We do this to reflect that growth tends to slow more in the early years than it does in later years.
Generally we assume that a dollar today is more valuable than a dollar in the future, so we need to discount the sum of these future cash flows to arrive at a present value estimate:
10-year free cash flow (FCF) estimate
2024
2025
2026
2027
2028
2029
2030
2031
2032
2033
Levered FCF ($, Millions)
US$881.0m
US$1.15b
US$1.24b
US$1.44b
US$1.52b
US$1.59b
US$1.65b
US$1.71b
US$1.76b
US$1.81b
Growth Rate Estimate Source
Analyst x5
Analyst x5
Analyst x4
Analyst x1
Analyst x1
Est @ 4.45%
Est @ 3.83%
Est @ 3.39%
Est @ 3.09%
Est @ 2.88%
Present Value ($, Millions) Discounted @ 7.1%
US$822
US$1.0k
US$1.0k
US$1.1k
US$1.1k
US$1.1k
US$1.0k
US$985
US$948
US$910
("Est" = FCF growth rate estimated by Simply Wall St) Present Value of 10-year Cash Flow (PVCF) = US$9.9b
The second stage is also known as Terminal Value, this is the business's cash flow after the first stage. For a number of reasons a very conservative growth rate is used that cannot exceed that of a country's GDP growth. In this case we have used the 5-year average of the 10-year government bond yield (2.4%) to estimate future growth. In the same way as with the 10-year 'growth' period, we discount future cash flows to today's value, using a cost of equity of 7.1%.
Present Value of Terminal Value (PVTV)= TV / (1 + r)10= US$39b÷ ( 1 + 7.1%)10= US$20b
The total value, or equity value, is then the sum of the present value of the future cash flows, which in this case is US$30b. To get the intrinsic value per share, we divide this by the total number of shares outstanding. Relative to the current share price of US$145, the company appears quite undervalued at a 32% discount to where the stock price trades currently. The assumptions in any calculation have a big impact on the valuation, so it is better to view this as a rough estimate, not precise down to the last cent.
NYSE:GPC Discounted Cash Flow June 5th 2024
Important Assumptions
Now the most important inputs to a discounted cash flow are the discount rate, and of course, the actual cash flows. If you don't agree with these result, have a go at the calculation yourself and play with the assumptions. The DCF also does not consider the possible cyclicality of an industry, or a company's future capital requirements, so it does not give a full picture of a company's potential performance. Given that we are looking at Genuine Parts as potential shareholders, the cost of equity is used as the discount rate, rather than the cost of capital (or weighted average cost of capital, WACC) which accounts for debt. In this calculation we've used 7.1%, which is based on a levered beta of 1.032. Beta is a measure of a stock's volatility, compared to the market as a whole. We get our beta from the industry average beta of globally comparable companies, with an imposed limit between 0.8 and 2.0, which is a reasonable range for a stable business.
SWOT Analysis for Genuine Parts
Strength
Earnings growth over the past year exceeded the industry.
Debt is well covered by earnings and cashflows.
Dividends are covered by earnings and cash flows.
Dividend information for GPC.
Weakness
Earnings growth over the past year is below its 5-year average.
Dividend is low compared to the top 25% of dividend payers in the Retail Distributors market.
Opportunity
Annual earnings are forecast to grow for the next 3 years.
Good value based on P/E ratio and estimated fair value.
Threat
Annual earnings are forecast to grow slower than the American market.
What else are analysts forecasting for GPC?
Next Steps:
Whilst important, the DCF calculation is only one of many factors that you need to assess for a company. The DCF model is not a perfect stock valuation tool. Preferably you'd apply different cases and assumptions and see how they would impact the company's valuation. If a company grows at a different rate, or if its cost of equity or risk free rate changes sharply, the output can look very different. Why is the intrinsic value higher than the current share price? For Genuine Parts, we've compiled three essential items you should further examine:
Risks: Take risks, for example - Genuine Parts has 2 warning signs we think you should be aware of.
Future Earnings: How does GPC's growth rate compare to its peers and the wider market? Dig deeper into the analyst consensus number for the upcoming years by interacting with our free analyst growth expectation chart.
Other Solid Businesses: Low debt, high returns on equity and good past performance are fundamental to a strong business. Why not explore our interactive list of stocks with solid business fundamentals to see if there are other companies you may not have considered!
PS. The Simply Wall St app conducts a discounted cash flow valuation for every stock on the NYSE every day. If you want to find the calculation for other stocks just search here.
Have feedback on this article? Concerned about the content?Get in touch with us directly. Alternatively, email editorial-team (at) simplywallst.com. This article by Simply Wall St is general in nature. We provide commentary based on historical data and analyst forecasts only using an unbiased methodology and our articles are not intended to be financial advice. It does not constitute a recommendation to buy or sell any stock, and does not take account of your objectives, or your financial situation. We aim to bring you long-term focused analysis driven by fundamental data. Note that our analysis may not factor in the latest price-sensitive company announcements or qualitative material. Simply Wall St has no position in any stocks mentioned.
主要見解
使用兩階段自由現金流至股東權益模型,Genuine Parts公允價值估計爲212美元。
Genuine Parts的145美元股價表明它可能被低估了32%。
對GPC的分析師價值目標爲168美元,比我們的公允價值估計低21%。
Genuine Parts Company (NYSE:GPC)相對其內在價值有多遠?我們將使用最新的財務數據來看看是否該股票被合理定價,採用折現現金流量模型(DCF)。信不信由你,從我們的例子中,你會發現這並不難!