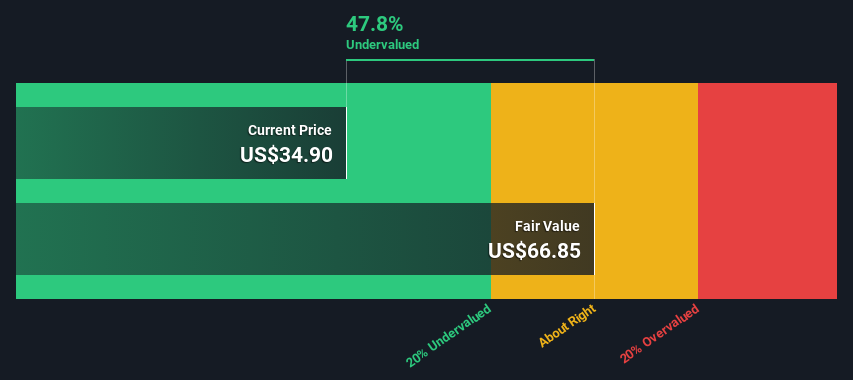
Helmerich & Payne's estimated fair value is US$66.85 based on 2 Stage Free Cash Flow to Equity
Helmerich & Payne is estimated to be 48% undervalued based on current share price of US$34.90
Our fair value estimate is 46% higher than Helmerich & Payne's analyst price target of US$45.68
In this article we are going to estimate the intrinsic value of Helmerich & Payne, Inc. (NYSE:HP) by projecting its future cash flows and then discounting them to today's value. We will use the Discounted Cash Flow (DCF) model on this occasion. Believe it or not, it's not too difficult to follow, as you'll see from our example!
We would caution that there are many ways of valuing a company and, like the DCF, each technique has advantages and disadvantages in certain scenarios. If you want to learn more about discounted cash flow, the rationale behind this calculation can be read in detail in the Simply Wall St analysis model.
The Calculation
We use what is known as a 2-stage model, which simply means we have two different periods of growth rates for the company's cash flows. Generally the first stage is higher growth, and the second stage is a lower growth phase. To begin with, we have to get estimates of the next ten years of cash flows. Where possible we use analyst estimates, but when these aren't available we extrapolate the previous free cash flow (FCF) from the last estimate or reported value. We assume companies with shrinking free cash flow will slow their rate of shrinkage, and that companies with growing free cash flow will see their growth rate slow, over this period. We do this to reflect that growth tends to slow more in the early years than it does in later years.
A DCF is all about the idea that a dollar in the future is less valuable than a dollar today, and so the sum of these future cash flows is then discounted to today's value:
10-year free cash flow (FCF) forecast
2024
2025
2026
2027
2028
2029
2030
2031
2032
2033
Levered FCF ($, Millions)
US$215.3m
US$299.1m
US$381.8m
US$430.5m
US$465.5m
US$492.2m
US$515.5m
US$536.2m
US$555.1m
US$572.8m
Growth Rate Estimate Source
Analyst x6
Analyst x7
Analyst x3
Analyst x2
Analyst x2
Est @ 5.73%
Est @ 4.73%
Est @ 4.02%
Est @ 3.53%
Est @ 3.19%
Present Value ($, Millions) Discounted @ 8.8%
US$198
US$252
US$296
US$307
US$305
US$296
US$285
US$272
US$259
US$245
("Est" = FCF growth rate estimated by Simply Wall St) Present Value of 10-year Cash Flow (PVCF) = US$2.7b
After calculating the present value of future cash flows in the initial 10-year period, we need to calculate the Terminal Value, which accounts for all future cash flows beyond the first stage. For a number of reasons a very conservative growth rate is used that cannot exceed that of a country's GDP growth. In this case we have used the 5-year average of the 10-year government bond yield (2.4%) to estimate future growth. In the same way as with the 10-year 'growth' period, we discount future cash flows to today's value, using a cost of equity of 8.8%.
Present Value of Terminal Value (PVTV)= TV / (1 + r)10= US$9.1b÷ ( 1 + 8.8%)10= US$3.9b
The total value, or equity value, is then the sum of the present value of the future cash flows, which in this case is US$6.6b. In the final step we divide the equity value by the number of shares outstanding. Relative to the current share price of US$34.9, the company appears quite undervalued at a 48% discount to where the stock price trades currently. Remember though, that this is just an approximate valuation, and like any complex formula - garbage in, garbage out.
NYSE:HP Discounted Cash Flow June 5th 2024
The Assumptions
We would point out that the most important inputs to a discounted cash flow are the discount rate and of course the actual cash flows. You don't have to agree with these inputs, I recommend redoing the calculations yourself and playing with them. The DCF also does not consider the possible cyclicality of an industry, or a company's future capital requirements, so it does not give a full picture of a company's potential performance. Given that we are looking at Helmerich & Payne as potential shareholders, the cost of equity is used as the discount rate, rather than the cost of capital (or weighted average cost of capital, WACC) which accounts for debt. In this calculation we've used 8.8%, which is based on a levered beta of 1.406. Beta is a measure of a stock's volatility, compared to the market as a whole. We get our beta from the industry average beta of globally comparable companies, with an imposed limit between 0.8 and 2.0, which is a reasonable range for a stable business.
SWOT Analysis for Helmerich & Payne
Strength
Debt is not viewed as a risk.
Dividends are covered by earnings and cash flows.
Dividend is in the top 25% of dividend payers in the market.
Dividend information for HP.
Weakness
Earnings growth over the past year underperformed the Energy Services industry.
Opportunity
Annual earnings are forecast to grow for the next 3 years.
Good value based on P/E ratio and estimated fair value.
Threat
Annual earnings are forecast to grow slower than the American market.
What else are analysts forecasting for HP?
Moving On:
Although the valuation of a company is important, it is only one of many factors that you need to assess for a company. The DCF model is not a perfect stock valuation tool. Rather it should be seen as a guide to "what assumptions need to be true for this stock to be under/overvalued?" If a company grows at a different rate, or if its cost of equity or risk free rate changes sharply, the output can look very different. What is the reason for the share price sitting below the intrinsic value? For Helmerich & Payne, there are three fundamental items you should explore:
Risks: Case in point, we've spotted 1 warning sign for Helmerich & Payne you should be aware of.
Future Earnings: How does HP's growth rate compare to its peers and the wider market? Dig deeper into the analyst consensus number for the upcoming years by interacting with our free analyst growth expectation chart.
Other Solid Businesses: Low debt, high returns on equity and good past performance are fundamental to a strong business. Why not explore our interactive list of stocks with solid business fundamentals to see if there are other companies you may not have considered!
PS. The Simply Wall St app conducts a discounted cash flow valuation for every stock on the NYSE every day. If you want to find the calculation for other stocks just search here.
Have feedback on this article? Concerned about the content?Get in touch with us directly. Alternatively, email editorial-team (at) simplywallst.com. This article by Simply Wall St is general in nature. We provide commentary based on historical data and analyst forecasts only using an unbiased methodology and our articles are not intended to be financial advice. It does not constitute a recommendation to buy or sell any stock, and does not take account of your objectives, or your financial situation. We aim to bring you long-term focused analysis driven by fundamental data. Note that our analysis may not factor in the latest price-sensitive company announcements or qualitative material. Simply Wall St has no position in any stocks mentioned.
主要見解
根據2階段自由現金流估值,Helmerich & Payne的預估公平價值爲66.85美元。
以當前股價34.90美元爲基礎,Helmerich & Payne的估值低於其公允價值的48%。
我們的公平價值估計比Helmerich & Payne的分析師價格目標45.68美元高46%。
本文將通過預測未來現金流並將其折現到今天的價值來評估Helmerich & Payne, Inc. (NYSE:HP) 的內在價值。我們將使用折現現金流模型 (DCF)。信不信由你,這並不太難,正如你從我們的示例中看到的那樣!