
The main point of investing for the long term is to make money. Better yet, you'd like to see the share price move up more than the market average. But Duke Energy Corporation (NYSE:DUK) has fallen short of that second goal, with a share price rise of 20% over five years, which is below the market return. Over the last twelve months the stock price has risen a very respectable 15%.
Let's take a look at the underlying fundamentals over the longer term, and see if they've been consistent with shareholders returns.
While markets are a powerful pricing mechanism, share prices reflect investor sentiment, not just underlying business performance. By comparing earnings per share (EPS) and share price changes over time, we can get a feel for how investor attitudes to a company have morphed over time.
 Over half a decade, Duke Energy managed to grow its earnings per share at 6.4% a year. This EPS growth is higher than the 4% average annual increase in the share price. Therefore, it seems the market has become relatively pessimistic about the company.
The company's earnings per share (over time) is depicted in the image below (click to see the exact numbers).
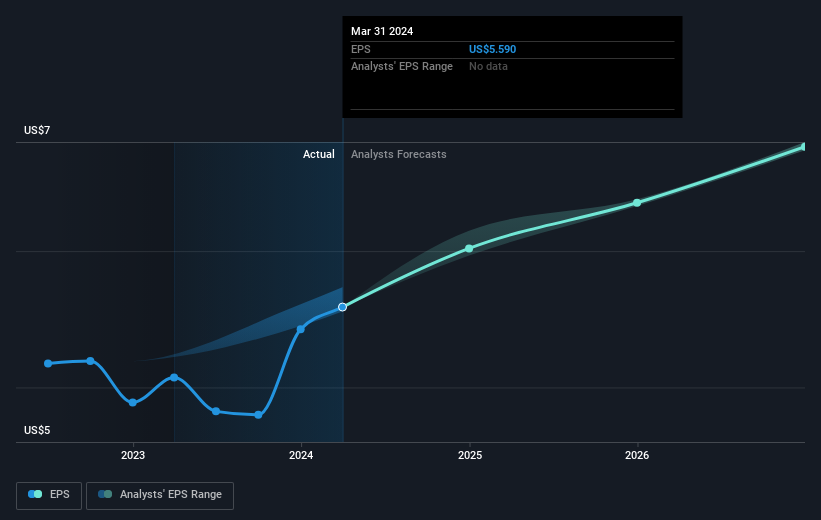
NYSE:DUK Earnings Per Share Growth June 4th 2024
We know that Duke Energy has improved its bottom line over the last three years, but what does the future have in store? Take a more thorough look at Duke Energy's financial health with this free report on its balance sheet.
What About Dividends?
As well as measuring the share price return, investors should also consider the total shareholder return (TSR). Whereas the share price return only reflects the change in the share price, the TSR includes the value of dividends (assuming they were reinvested) and the benefit of any discounted capital raising or spin-off. It's fair to say that the TSR gives a more complete picture for stocks that pay a dividend. In the case of Duke Energy, it has a TSR of 47% for the last 5 years. That exceeds its share price return that we previously mentioned. This is largely a result of its dividend payments!
A Different Perspective
Duke Energy shareholders gained a total return of 20% during the year. Unfortunately this falls short of the market return. The silver lining is that the gain was actually better than the average annual return of 8% per year over five year. This suggests the company might be improving over time. While it is well worth considering the different impacts that market conditions can have on the share price, there are other factors that are even more important. Like risks, for instance. Every company has them, and we've spotted 3 warning signs for Duke Energy (of which 1 is significant!) you should know about.
For those who like to find winning investments this free list of undervalued companies with recent insider purchasing, could be just the ticket.
Please note, the market returns quoted in this article reflect the market weighted average returns of stocks that currently trade on American exchanges.
Have feedback on this article? Concerned about the content? Get in touch with us directly. Alternatively, email editorial-team (at) simplywallst.com.
This article by Simply Wall St is general in nature. We provide commentary based on historical data and analyst forecasts only using an unbiased methodology and our articles are not intended to be financial advice. It does not constitute a recommendation to buy or sell any stock, and does not take account of your objectives, or your financial situation. We aim to bring you long-term focused analysis driven by fundamental data. Note that our analysis may not factor in the latest price-sensitive company announcements or qualitative material. Simply Wall St has no position in any stocks mentioned.