
Slowing Rates Of Return At Getty Images Holdings (NYSE:GETY) Leave Little Room For Excitement
Slowing Rates Of Return At Getty Images Holdings (NYSE:GETY) Leave Little Room For Excitement
What trends should we look for it we want to identify stocks that can multiply in value over the long term? Firstly, we'll want to see a proven return on capital employed (ROCE) that is increasing, and secondly, an expanding base of capital employed. Basically this means that a company has profitable initiatives that it can continue to reinvest in, which is a trait of a compounding machine. However, after briefly looking over the numbers, we don't think Getty Images Holdings (NYSE:GETY) has the makings of a multi-bagger going forward, but let's have a look at why that may be.
如果我們想確定股票長期增值的趨勢,我們應遵循以下所有規則。首先,我們需要看到資本使用的證明。這基本上意味着公司有盈利的舉措,它可以繼續投資,這是複合機器的特點。資產回報率:它是什麼?了解資本使用回報率(ROCE)如果你以前沒有接觸過ROCE,它衡量公司從資本使用中產生的“回報”(稅前利潤)。要爲洪恩計算此指標,這是公式:資產回報率 = 利息和所得稅前收益(EBIT)÷(總資產-流動負債)但是,簡要查看數字後,我們認爲Getty Images Holdings(NYSE:GETY)未來不具備成爲多倍利潤的因素,但讓我們看看原因。
What Is Return On Capital Employed (ROCE)?
我們對 Enphase Energy 的資本僱用回報率的看法:正如我們上面看到的,Enphase Energy 的資本回報率沒有提高,但它正在重新投資於業務。投資者必須認爲未來會有更好的前景,因爲股票表現良好,使持股五年以上的股東獲得了 690% 的收益。最終,如果基本趨勢持續存在,我們不會對它成爲一隻多頭股持有期很久很有信心。
For those who don't know, ROCE is a measure of a company's yearly pre-tax profit (its return), relative to the capital employed in the business. The formula for this calculation on Getty Images Holdings is:
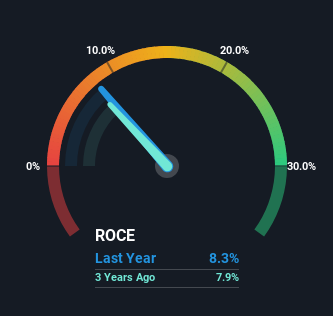
對於不知道ROCE的人,ROCE是公司每年稅前利潤(其回報),相對於企業所使用的資本的衡量標準。這種計算方法在Getty Images Holdings上的公式爲:0.083 = 1.79億美元÷(26億美元-4.22億美元)。因此,Getty Images Holdings的ROCE爲8.3%。單獨看這一數字,回報率很低,但與互動媒體和服務業平均6.4%生成的平均值相比,要好得多。
Return on Capital Employed = Earnings Before Interest and Tax (EBIT) ÷ (Total Assets - Current Liabilities)
資產僱用回報率(ROCE)是指企業利潤,即企業稅前利潤除以企業投入的總資本(負債加股權)。如果ROCE高於企業財務成本的承受能力,那麼企業就會創造出更多的價值。
0.083 = US$179m ÷ (US$2.6b - US$422m) (Based on the trailing twelve months to March 2024).
0.083 = 美元179百萬 ÷ (美元26億 - 美元4.22億)在Elevance Health上,我們已經注意到的趨勢是相當令人放心的。數據顯示,過去五年資產回報率大幅提高至15%。投資所用資產的規模也增加了30%。這表明有很多機會進行內部資本投資,並以更高的速度不斷增長,這種組合在多倍增長方面很常見。.
So, Getty Images Holdings has an ROCE of 8.3%. On its own that's a low return, but compared to the average of 6.4% generated by the Interactive Media and Services industry, it's much better.
上面您可以看到Getty Images Holdings當前ROCE與其以往資本回報相比的情況,但過去能夠告訴我們的信息有限。如果您願意,您可以免費查看覆蓋Getty Images Holdings的分析師的預測。
Above you can see how the current ROCE for Getty Images Holdings compares to its prior returns on capital, but there's only so much you can tell from the past. If you'd like, you can check out the forecasts from the analysts covering Getty Images Holdings for free.
但過去能夠告訴我們的信息有限。如果您願意,您可以免費查看覆蓋Getty Images Holdings的分析師的預測。
What Can We Tell From Getty Images Holdings' ROCE Trend?
我們從Getty Images Holdings的ROCE趨勢中能了解到什麼?
Over the past three years, Getty Images Holdings' ROCE and capital employed have both remained mostly flat. It's not uncommon to see this when looking at a mature and stable business that isn't re-investing its earnings because it has likely passed that phase of the business cycle. With that in mind, unless investment picks up again in the future, we wouldn't expect Getty Images Holdings to be a multi-bagger going forward.
過去三年,Getty Images Holdings的ROCE和使用資本都基本保持不變。在查看成熟穩定的業務時,這種情況並不罕見,因爲它不再投資其收益,因爲它很可能已經過了這個業務週期的階段。因此,除非未來的投資再次增加,否則我們不希望Getty Images Holdings未來成爲多倍高手。
The Bottom Line
還有一件事需要注意的是,我們已經確定了上海醫藥的2個警告信號,了解這些信號應該成爲你的投資過程的一部分。
We can conclude that in regards to Getty Images Holdings' returns on capital employed and the trends, there isn't much change to report on. Since the stock has declined 64% over the last three years, investors may not be too optimistic on this trend improving either. All in all, the inherent trends aren't typical of multi-baggers, so if that's what you're after, we think you might have more luck elsewhere.
綜上所述,關於Getty Images Holdings的資本回報率和趨勢,沒有什麼可報告的變化。由於過去三年該股已下跌64%,投資者對此趨勢的改善可能並不太樂觀。總之,內在趨勢並不典型,因此如果您想這樣做,我們認爲您可以在其他方面更加幸運。
Getty Images Holdings does have some risks, we noticed 4 warning signs (and 1 which is significant) we think you should know about.
Getty Images Holdings確實存在一些風險,我們注意到有4個警告信號(其中1個很重要),我們認爲您應該知道。
If you want to search for solid companies with great earnings, check out this free list of companies with good balance sheets and impressive returns on equity.
如果您想尋找財務狀況良好、回報卓越的實力強企業,可以免費查看以下公司列表。
Have feedback on this article? Concerned about the content? Get in touch with us directly. Alternatively, email editorial-team (at) simplywallst.com.
This article by Simply Wall St is general in nature. We provide commentary based on historical data and analyst forecasts only using an unbiased methodology and our articles are not intended to be financial advice. It does not constitute a recommendation to buy or sell any stock, and does not take account of your objectives, or your financial situation. We aim to bring you long-term focused analysis driven by fundamental data. Note that our analysis may not factor in the latest price-sensitive company announcements or qualitative material. Simply Wall St has no position in any stocks mentioned.
對本文有反饋?關於內容有所顧慮?直接和我們聯繫。或者,發送電子郵件至editorial-team (at) simplywallst.com。
這篇文章是Simply Wall St的一般性文章。我們根據歷史數據和分析師預測提供評論,只使用公正的方法論,我們的文章並不意味着提供任何金融建議。文章不構成買賣任何股票的建議,也不考慮您的目標或您的財務狀況。我們的目標是帶給您基本數據驅動的長期關注分析。請注意,我們的分析可能不考慮最新的價格敏感公司公告或定性材料。Simply Wall St沒有任何股票頭寸。
譯文內容由第三人軟體翻譯。