
The Total Return for ACM Research (NASDAQ:ACMR) Investors Has Risen Faster Than Earnings Growth Over the Last Five Years
The Total Return for ACM Research (NASDAQ:ACMR) Investors Has Risen Faster Than Earnings Growth Over the Last Five Years
 During five years of share price growth, ACM Research achieved compound earnings per share (EPS) growth of 43% per year. This EPS growth is higher than the 29% average annual increase in the share price. Therefore, it seems the market has become relatively pessimistic about the company.
 The last three months have been tough on ACM Research, Inc. (NASDAQ:ACMR) shareholders, who have seen the share price decline a rather worrying 36%. But that scarcely detracts from the really solid long term returns generated by the company over five years. It's fair to say most would be happy with 251% the gain in that time. Generally speaking the long term returns will give you a better idea of business quality than short periods can. Ultimately business performance will determine whether the stock price continues the positive long term trend.
過去三個月對ACM Research, Inc.(納斯達克股票代碼:ACMR)的股東來說一直很艱難,他們的股價下跌了36%,相當令人擔憂。但這絲毫不影響該公司在五年內創造的真正穩健的長期回報。可以公平地說,大多數人會對那段時間內251%的漲幅感到滿意。一般而言,與短期回報相比,長期回報將使您更好地了解業務質量。最終,業務表現將決定股價是否延續長期的積極趨勢。
Since the long term performance has been good but there's been a recent pullback of 4.3%, let's check if the fundamentals match the share price.
由於長期表現良好,但最近回調了4.3%,因此讓我們檢查一下基本面是否與股價相符。
There is no denying that markets are sometimes efficient, but prices do not always reflect underlying business performance. One way to examine how market sentiment has changed over time is to look at the interaction between a company's share price and its earnings per share (EPS).
不可否認,市場有時是有效的,但價格並不總是能反映潛在的業務表現。研究市場情緒如何隨着時間的推移而變化的一種方法是研究公司股價與其每股收益(EPS)之間的相互作用。
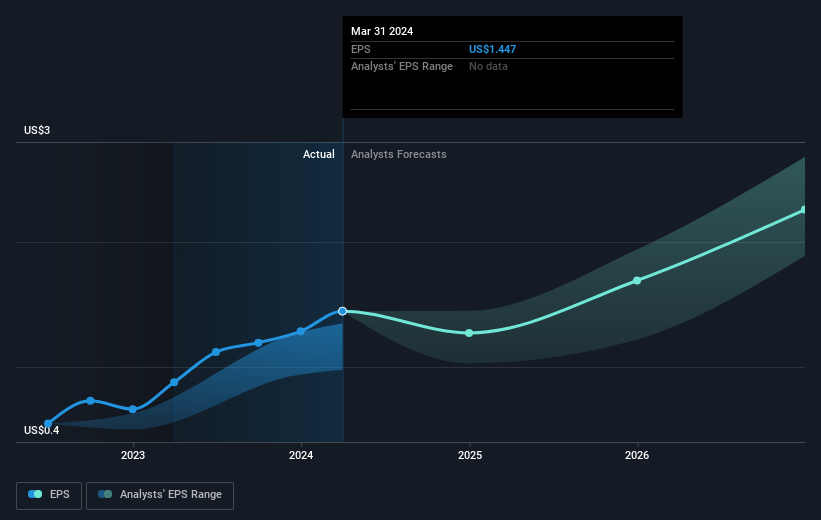
During five years of share price growth, ACM Research achieved compound earnings per share (EPS) growth of 43% per year. This EPS growth is higher than the 29% average annual increase in the share price. Therefore, it seems the market has become relatively pessimistic about the company.
在五年的股價增長中,ACM Research實現了每年43%的複合每股收益(EPS)增長。每股收益的增長高於股價29%的平均年增長率。因此,市場似乎對該公司變得相對悲觀。
The image below shows how EPS has tracked over time (if you click on the image you can see greater detail).
下圖顯示了 EPS 在一段時間內的跟蹤情況(如果你點擊圖片,你可以看到更多細節)。
It is of course excellent to see how ACM Research has grown profits over the years, but the future is more important for shareholders. This free interactive report on ACM Research's balance sheet strength is a great place to start, if you want to investigate the stock further.
看到ACM Research多年來如何增加利潤當然是件好事,但未來對股東來說更爲重要。如果你想進一步調查該股,這份關於ACM Research資產負債表實力的免費互動報告是一個很好的起點。
A Different Perspective
不同的視角
We're pleased to report that ACM Research shareholders have received a total shareholder return of 117% over one year. That gain is better than the annual TSR over five years, which is 29%. Therefore it seems like sentiment around the company has been positive lately. Someone with an optimistic perspective could view the recent improvement in TSR as indicating that the business itself is getting better with time. I find it very interesting to look at share price over the long term as a proxy for business performance. But to truly gain insight, we need to consider other information, too. Like risks, for instance. Every company has them, and we've spotted 2 warning signs for ACM Research (of which 1 is a bit unpleasant!) you should know about.
我們很高興地向大家報告,ACM Research的股東在一年內獲得了117%的總股東回報率。這一增幅好於五年內的年度股東總回報率,即29%。因此,最近公司周圍的情緒似乎一直很樂觀。持樂觀態度的人可能會將最近股東總回報率的改善視爲業務本身隨着時間的推移而變得更好。我發現將長期股價視爲業務績效的代表非常有趣。但是,要真正獲得見解,我們還需要考慮其他信息。比如風險。每家公司都有它們,我們發現了 ACM Research 的 2 個警告信號(其中 1 個有點不愉快!)你應該知道。
For those who like to find winning investments this free list of undervalued companies with recent insider purchasing, could be just the ticket.
對於那些喜歡尋找獲利投資的人來說,這份最近進行內幕收購的被低估公司的免費清單可能只是入場券。
Please note, the market returns quoted in this article reflect the market weighted average returns of stocks that currently trade on American exchanges.
請注意,本文引用的市場回報反映了目前在美國交易所交易的股票的市場加權平均回報。
Have feedback on this article? Concerned about the content? Get in touch with us directly. Alternatively, email editorial-team (at) simplywallst.com.
This article by Simply Wall St is general in nature. We provide commentary based on historical data and analyst forecasts only using an unbiased methodology and our articles are not intended to be financial advice. It does not constitute a recommendation to buy or sell any stock, and does not take account of your objectives, or your financial situation. We aim to bring you long-term focused analysis driven by fundamental data. Note that our analysis may not factor in the latest price-sensitive company announcements or qualitative material. Simply Wall St has no position in any stocks mentioned.
對這篇文章有反饋嗎?對內容感到擔憂?直接聯繫我們。 或者,給編輯團隊 (at) simplywallst.com 發送電子郵件。
Simply Wall St的這篇文章本質上是籠統的。我們僅使用公正的方法根據歷史數據和分析師的預測提供評論,我們的文章無意作爲財務建議。它不構成買入或賣出任何股票的建議,也沒有考慮到您的目標或財務狀況。我們的目標是爲您提供由基本數據驅動的長期重點分析。請注意,我們的分析可能不考慮最新的價格敏感型公司公告或定性材料。簡而言之,華爾街沒有持有任何上述股票的頭寸。
譯文內容由第三人軟體翻譯。