
Optimism Around Revvity (NYSE:RVTY) Delivering New Earnings Growth May Be Shrinking as Stock Declines 4.4% This Past Week
Optimism Around Revvity (NYSE:RVTY) Delivering New Earnings Growth May Be Shrinking as Stock Declines 4.4% This Past Week
In order to justify the effort of selecting individual stocks, it's worth striving to beat the returns from a market index fund. But its virtually certain that sometimes you will buy stocks that fall short of the market average returns. Unfortunately, that's been the case for longer term Revvity, Inc. (NYSE:RVTY) shareholders, since the share price is down 22% in the last three years, falling well short of the market return of around 18%.
爲了證明選擇個股的努力是有價值的,值得努力超越市場指數基金的收益。但幾乎可以確定,有時您會購買表現不及市場平均水平的股票。不幸的是,在過去的三年中,Revity公司(紐約證券交易所:RVTY)的股價下跌了22%,遠遠低於市場回報率約18%。
Since Revvity has shed US$608m from its value in the past 7 days, let's see if the longer term decline has been driven by the business' economics.
由於Revvity在過去7天中已經失去了6.08億美元的市值,讓我們看看長期的下跌是否是由企業的經濟學驅動的。
In his essay The Superinvestors of Graham-and-Doddsville Warren Buffett described how share prices do not always rationally reflect the value of a business. One flawed but reasonable way to assess how sentiment around a company has changed is to compare the earnings per share (EPS) with the share price.
在他的文章《格雷厄姆和多德斯維爾超級投資者》中,禾倫·巴菲特描述了股票價格並不總是反映公司價值的合理方式。考慮市場對公司的看法如何發生變化的一個不完美但簡單的方法是將每股收益(EPS)的變化與股價的變動進行比較。股票價格並不總是反映公司價值的合理方式禾倫·巴菲特曾經描述過,股價並不總是理性地反映了企業的價值。評估市場對一家公司的情緒如何變化的一個有缺陷但合理的方法是將每股收益(EPS)與股價進行比較。
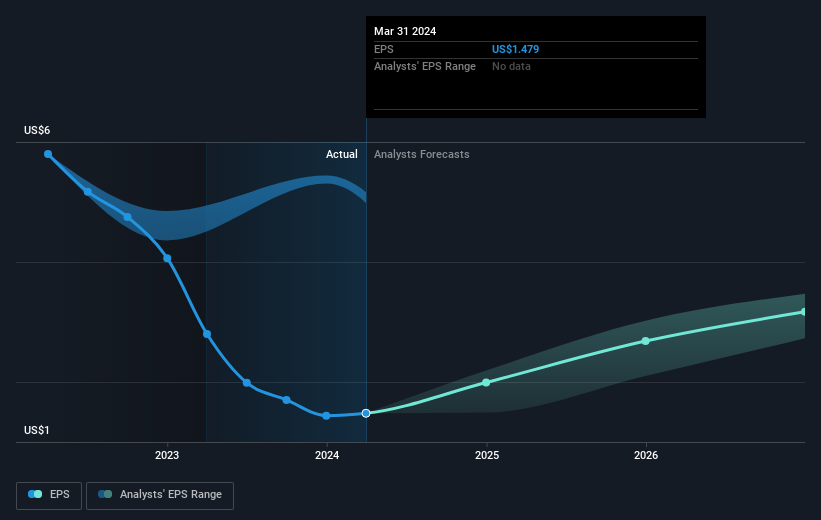
During the three years that the share price fell, Revvity's earnings per share (EPS) dropped by 46% each year. In comparison the 8% compound annual share price decline isn't as bad as the EPS drop-off. This suggests that the market retains some optimism around long term earnings stability, despite past EPS declines. This positive sentiment is also reflected in the generous P/E ratio of 72.91.
股價下跌的三年期間,Revvity的每股收益(EPS)每年下降了46%。與之相比,每年8%的年複合股價下降並不像EPS下降那麼糟糕。這表明市場保持一些樂觀情緒,認爲長期收益穩定性仍然存在,儘管過去的EPS下降。這種積極情緒也體現在慷慨的市盈率72.91上。
You can see how EPS has changed over time in the image below (click on the chart to see the exact values).
您可以在下面的圖片中查看每股收益如何隨時間變化(單擊圖表以查看確切的價值)。
This free interactive report on Revvity's earnings, revenue and cash flow is a great place to start, if you want to investigate the stock further.
如果您想進一步調查該股票,Revvity的這份免費互動報告涵蓋了公司的盈利、營業收入和現金流,是一個很好的起點。
A Different Perspective
不同的觀點
Revvity shareholders are down 5.7% for the year (even including dividends), but the market itself is up 23%. Even the share prices of good stocks drop sometimes, but we want to see improvements in the fundamental metrics of a business, before getting too interested. Longer term investors wouldn't be so upset, since they would have made 3%, each year, over five years. If the fundamental data continues to indicate long term sustainable growth, the current sell-off could be an opportunity worth considering. While it is well worth considering the different impacts that market conditions can have on the share price, there are other factors that are even more important. Case in point: We've spotted 2 warning signs for Revvity you should be aware of.
Revvity股東今年下跌了5.7%(包括分紅),但市場本身上漲了23%。即使是好股票的股價有時也會下跌,但是在過於感興趣之前,我們希望看到企業基本指標的改善。長期投資者不會感到太沮喪,因爲他們在五年內每年賺取3%的回報。如果基本數據繼續表明長期可持續增長,當前的拋售可能是值得考慮的機會。雖然考慮市場條件可能對股價產生的不同影響是值得的,但還有其他更重要的因素。點題的是:我們已經發現了Revvity的2個警示信號,您應該注意。
We will like Revvity better if we see some big insider buys. While we wait, check out this free list of undervalued stocks (mostly small caps) with considerable, recent, insider buying.
如果我們看到一些大量的內部人員買入,我們會更喜歡Revvity。在等待時,可以查看此免費的低估股票(主要是小盤股),其中包含相當數量的最近的內部人員買入。
Please note, the market returns quoted in this article reflect the market weighted average returns of stocks that currently trade on American exchanges.
請注意,本文所引述的市場回報反映了目前在美國交易所上市的股票的市場加權平均回報。
Have feedback on this article? Concerned about the content? Get in touch with us directly. Alternatively, email editorial-team (at) simplywallst.com.
This article by Simply Wall St is general in nature. We provide commentary based on historical data and analyst forecasts only using an unbiased methodology and our articles are not intended to be financial advice. It does not constitute a recommendation to buy or sell any stock, and does not take account of your objectives, or your financial situation. We aim to bring you long-term focused analysis driven by fundamental data. Note that our analysis may not factor in the latest price-sensitive company announcements or qualitative material. Simply Wall St has no position in any stocks mentioned.
對本文有反饋?關於內容有所顧慮?直接和我們聯繫。或者,發送電子郵件至editorial-team (at) simplywallst.com。
這篇文章是Simply Wall St的一般性文章。我們根據歷史數據和分析師預測提供評論,只使用公正的方法論,我們的文章並不意味着提供任何金融建議。文章不構成買賣任何股票的建議,也不考慮您的目標或您的財務狀況。我們的目標是帶給您基本數據驅動的長期關注分析。請注意,我們的分析可能不考慮最新的價格敏感公司公告或定性材料。Simply Wall St沒有任何股票頭寸。
譯文內容由第三人軟體翻譯。