
Red Rock Resorts' (NASDAQ:RRR) Earnings Growth Rate Lags the 22% CAGR Delivered to Shareholders
Red Rock Resorts' (NASDAQ:RRR) Earnings Growth Rate Lags the 22% CAGR Delivered to Shareholders
While Red Rock Resorts, Inc. (NASDAQ:RRR) shareholders are probably generally happy, the stock hasn't had particularly good run recently, with the share price falling 14% in the last quarter. But that doesn't change the fact that shareholders have received really good returns over the last five years. In fact, the share price is 124% higher today. We think it's more important to dwell on the long term returns than the short term returns. The more important question is whether the stock is too cheap or too expensive today.
儘管納斯達克:RRR的股東可能普遍感到滿意,但股票最近的表現並不好,股價在上個季度下跌了14%。但這並不改變股東在過去五年中獲得了真正好的回報的事實。事實上,股價今天比五年前高124%。我們認爲,關注長期回報比短期回報更重要。更重要的問題是股票今天是否過於便宜或過於昂貴。
Since the long term performance has been good but there's been a recent pullback of 4.8%, let's check if the fundamentals match the share price.
由於長期表現良好,但最近回調了4.8%,讓我們檢查一下基本面是否與股票價格相匹配。
While markets are a powerful pricing mechanism, share prices reflect investor sentiment, not just underlying business performance. One way to examine how market sentiment has changed over time is to look at the interaction between a company's share price and its earnings per share (EPS).
儘管市場是一個強大的價格機制,但股票價格反映的不僅是潛在業務績效,還反映了投資者的情緒。 了解市場情緒隨時間的變化的一種方法是查看公司的股價與每股收益(EPS)之間的互動。
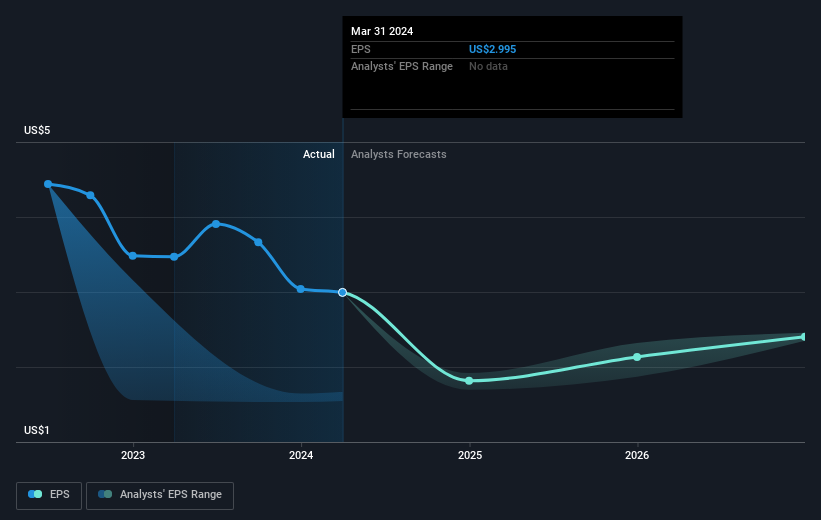
During the last half decade, Red Rock Resorts became profitable. That kind of transition can be an inflection point that justifies a strong share price gain, just as we have seen here.
在過去的半個十年中,紅石度假村實現了盈利。這種轉變可以是一個拐點,能夠使股價有強勁的上漲,就像我們在這裏看到的一樣。
The image below shows how EPS has tracked over time (if you click on the image you can see greater detail).
下圖顯示了EPS隨時間的變化情況(如果您單擊該圖像,則可以查看更多詳細信息)。
It's probably worth noting that the CEO is paid less than the median at similar sized companies. But while CEO remuneration is always worth checking, the really important question is whether the company can grow earnings going forward. Dive deeper into the earnings by checking this interactive graph of Red Rock Resorts' earnings, revenue and cash flow.
值得注意的是,總裁的薪酬低於類似規模公司的中位數。但雖然總裁的薪酬始終值得覈查,但真正重要的問題是公司未來能否增長收益。通過查看紅石度假村的收益,營業收入和現金流的互動圖,更深入地了解收益情況。
What About Dividends?
那麼分紅怎麼樣呢?
It is important to consider the total shareholder return, as well as the share price return, for any given stock. The TSR is a return calculation that accounts for the value of cash dividends (assuming that any dividend received was reinvested) and the calculated value of any discounted capital raisings and spin-offs. Arguably, the TSR gives a more comprehensive picture of the return generated by a stock. In the case of Red Rock Resorts, it has a TSR of 167% for the last 5 years. That exceeds its share price return that we previously mentioned. The dividends paid by the company have thusly boosted the total shareholder return.
考慮任何給定股票的總股東回報以及股票回報非常重要。 TSR是一個回報計算,它賬面計算了現金股利的價值(假設收到的任何股利都被再投資)和任何折現的增資和分拆的計算值。可以認爲,TSR提供了股票所產生的回報更全面的畫面。在紅石度假村的情況下,過去5年它的TSR爲167%。這超過了我們之前提到的股價回報。公司支付的股息因此提高了總股東回報。總股東回報。
A Different Perspective
不同的觀點
Red Rock Resorts shareholders are up 11% for the year (even including dividends). Unfortunately this falls short of the market return. It's probably a good sign that the company has an even better long term track record, having provided shareholders with an annual TSR of 22% over five years. It's quite possible the business continues to execute with prowess, even as the share price gains are slowing. It's always interesting to track share price performance over the longer term. But to understand Red Rock Resorts better, we need to consider many other factors. Consider for instance, the ever-present spectre of investment risk. We've identified 2 warning signs with Red Rock Resorts (at least 1 which is potentially serious) , and understanding them should be part of your investment process.
紅石度假村的股東今年獲得了11%的回報(包括股息)。不幸的是,這跑輸了市場回報。長期跟蹤股票價格表現始終是有趣的。但要更好地了解紅石度假村,我們需要考慮許多其他因素。比如說,始終存在投資風險的威脅。我們已經確定了紅石度假村的2個警告信號(至少有1個潛在嚴重),了解它們應該是您的投資過程的一部分。
We will like Red Rock Resorts better if we see some big insider buys. While we wait, check out this free list of undervalued stocks (mostly small caps) with considerable, recent, insider buying.
如果我們看到一些內部人員購買,我們會更喜歡紅石度假村。在等待期間,請查看這個免費的低估股票清單(主要是小市值股票),其中包括相當多的內部購買。
Please note, the market returns quoted in this article reflect the market weighted average returns of stocks that currently trade on American exchanges.
請注意,本文所引述的市場回報反映了目前在美國交易所上市的股票的市場加權平均回報。
Have feedback on this article? Concerned about the content? Get in touch with us directly. Alternatively, email editorial-team (at) simplywallst.com.
This article by Simply Wall St is general in nature. We provide commentary based on historical data and analyst forecasts only using an unbiased methodology and our articles are not intended to be financial advice. It does not constitute a recommendation to buy or sell any stock, and does not take account of your objectives, or your financial situation. We aim to bring you long-term focused analysis driven by fundamental data. Note that our analysis may not factor in the latest price-sensitive company announcements or qualitative material. Simply Wall St has no position in any stocks mentioned.
對本文有反饋?關於內容有所顧慮?直接和我們聯繫。或者,發送電子郵件至editorial-team (at) simplywallst.com。
這篇文章是Simply Wall St的一般性文章。我們根據歷史數據和分析師預測提供評論,只使用公正的方法論,我們的文章並不意味着提供任何金融建議。文章不構成買賣任何股票的建議,也不考慮您的目標或您的財務狀況。我們的目標是帶給您基本數據驅動的長期關注分析。請注意,我們的分析可能不考慮最新的價格敏感公司公告或定性材料。Simply Wall St沒有任何股票頭寸。
譯文內容由第三人軟體翻譯。