
Investors Could Be Concerned With Teleflex's (NYSE:TFX) Returns On Capital
Investors Could Be Concerned With Teleflex's (NYSE:TFX) Returns On Capital
If we want to find a stock that could multiply over the long term, what are the underlying trends we should look for? Ideally, a business will show two trends; firstly a growing return on capital employed (ROCE) and secondly, an increasing amount of capital employed. Basically this means that a company has profitable initiatives that it can continue to reinvest in, which is a trait of a compounding machine. Although, when we looked at Teleflex (NYSE:TFX), it didn't seem to tick all of these boxes.
如果我們想尋找一隻股票,在長期內能夠增值,我們應該尋找什麼樣的基本趨勢呢?理想情況下,一家企業將展現兩種趨勢;首先是資本的增長。基本上這意味着一個公司擁有可以繼續投資的盈利倡議,這是複合機器的特質。鑑於此,我們看到的伊克賽爾服務 (NASDAQ:EXLS) 的趨勢非常有前途,所以讓我們來看一下。資產回報率:它是什麼?資本使用率回報(ROCE)是什麼?數量基本上,這意味着公司有盈利的計劃,可以繼續投資,這是一個複合機器的特徵。但是,當我們看泰利福(紐交所:TFX)時,似乎它沒有滿足所有這些條件。
What Is Return On Capital Employed (ROCE)?
資本僱用回報率(ROCE)是什麼?
For those who don't know, ROCE is a measure of a company's yearly pre-tax profit (its return), relative to the capital employed in the business. Analysts use this formula to calculate it for Teleflex:
對於不了解的人來說,ROCE是衡量公司每年的稅前利潤(回報)與業務中所投資的資本的比率的一種方法。分析師使用這個公式爲泰利福計算ROCE:
Return on Capital Employed = Earnings Before Interest and Tax (EBIT) ÷ (Total Assets - Current Liabilities)
資本僱用回報率=利息和稅前收益(EBIT)÷(總資產-流動負債)
0.055 = US$381m ÷ (US$7.5b - US$571m) (Based on the trailing twelve months to March 2024).
0.055 = 美元3.81億 ÷(75億美元-5.71億美元)在Elevance Health上,我們已經注意到的趨勢是相當令人放心的。數據顯示,過去五年資產回報率大幅提高至15%。投資所用資產的規模也增加了30%。這表明有很多機會進行內部資本投資,並以更高的速度不斷增長,這種組合在多倍增長方面很常見。.
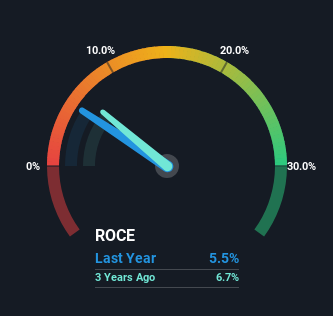
So, Teleflex has an ROCE of 5.5%. Ultimately, that's a low return and it under-performs the Medical Equipment industry average of 10%.
所以,泰利福的ROCE爲5.5%。最終,這是一個較低的回報率,並且其低於醫療設備行業平均水平10%。
In the above chart we have measured Teleflex's prior ROCE against its prior performance, but the future is arguably more important. If you'd like, you can check out the forecasts from the analysts covering Teleflex for free.
在上面的圖表中,我們已經測量了泰利福的先前ROCE與其先前業績相比,但未來可能更重要。如果您願意,您可以免費查看覆蓋泰利福的分析師的預測。
What Can We Tell From Teleflex's ROCE Trend?
從泰利福的ROCE趨勢中我們能看出什麼?
In terms of Teleflex's historical ROCE movements, the trend isn't fantastic. Around five years ago the returns on capital were 7.9%, but since then they've fallen to 5.5%. However it looks like Teleflex might be reinvesting for long term growth because while capital employed has increased, the company's sales haven't changed much in the last 12 months. It may take some time before the company starts to see any change in earnings from these investments.
就泰利福歷史上的ROCE走勢而言,其趨勢並不理想。大約五年前,資本回報率爲7.9%,但自那以後已降至5.5%。然而,看起來泰利福可能正在進行爲期長遠的增長的再投資,因爲雖然資本投入增加了,但公司的銷售額在過去的12個月中並沒有太大變化。公司可能需要一些時間才能從這些投資中看到收益的改變。
In Conclusion...
最後,同等資本下回報率較低的趨勢通常不是我們關注創業板股票的最佳信號。由於這些發展進行良好,因此投資者不太可能表現友好。自五年前以來,該股下跌了32%。除非這些指標朝着更積極的軌跡轉變,否則我們將繼續尋找其他股票。
In summary, Teleflex is reinvesting funds back into the business for growth but unfortunately it looks like sales haven't increased much just yet. And investors appear hesitant that the trends will pick up because the stock has fallen 27% in the last five years. On the whole, we aren't too inspired by the underlying trends and we think there may be better chances of finding a multi-bagger elsewhere.
總之,泰利福正在將資金重新投入業務以促進增長,但不幸的是,銷售額似乎還沒有大幅增長。投資者似乎對趨勢會持續下去並不懷疑,因爲過去五年股票已經下跌了27%。總體來說,我們對基本趨勢並不太有信心,認爲可能有更好的機會在其他地方找到多倍投資股。
Teleflex could be trading at an attractive price in other respects, so you might find our free intrinsic value estimation for TFX on our platform quite valuable.
在其他方面,泰利福的交易價格可能很具吸引力,因此您可能會發現我們平台上免費提供TFX的內在價值估算很有價值。
While Teleflex may not currently earn the highest returns, we've compiled a list of companies that currently earn more than 25% return on equity. Check out this free list here.
雖然泰利福目前可能沒有獲得最高回報,但我們已經編制了一份收益率超過25%的公司列表。在這裏免費查看該列表。
Have feedback on this article? Concerned about the content? Get in touch with us directly. Alternatively, email editorial-team (at) simplywallst.com.
This article by Simply Wall St is general in nature. We provide commentary based on historical data and analyst forecasts only using an unbiased methodology and our articles are not intended to be financial advice. It does not constitute a recommendation to buy or sell any stock, and does not take account of your objectives, or your financial situation. We aim to bring you long-term focused analysis driven by fundamental data. Note that our analysis may not factor in the latest price-sensitive company announcements or qualitative material. Simply Wall St has no position in any stocks mentioned.
對本文有反饋?關於內容有所顧慮?直接和我們聯繫。或者,發送電子郵件至editorial-team (at) simplywallst.com。
這篇文章是Simply Wall St的一般性文章。我們根據歷史數據和分析師預測提供評論,只使用公正的方法論,我們的文章並不意味着提供任何金融建議。文章不構成買賣任何股票的建議,也不考慮您的目標或您的財務狀況。我們的目標是帶給您基本數據驅動的長期關注分析。請注意,我們的分析可能不考慮最新的價格敏感公司公告或定性材料。Simply Wall St沒有任何股票頭寸。
譯文內容由第三人軟體翻譯。