
The Five-year Decline in Earnings Might Be Taking Its Toll on OGE Energy (NYSE:OGE) Shareholders as Stock Falls 3.6% Over the Past Week
The Five-year Decline in Earnings Might Be Taking Its Toll on OGE Energy (NYSE:OGE) Shareholders as Stock Falls 3.6% Over the Past Week
 Looking back five years, both OGE Energy's share price and EPS declined; the latter at a rate of 1.1% per year. This reduction in EPS is less than the 3% annual reduction in the share price. This implies that the market was previously too optimistic about the stock.
 For many, the main point of investing is to generate higher returns than the overall market. But even the best stock picker will only win with some selections. So we wouldn't blame long term OGE Energy Corp. (NYSE:OGE) shareholders for doubting their decision to hold, with the stock down 15% over a half decade.
對許多人來說,投資的主要目的是比整體市場產生更高的回報。但即使是最好的股票選手,也只能靠選擇獲勝。因此,我們不會責怪長揸 OGE Energy Corp. (紐交所:oge energy) 股票的股東對其決定產生懷疑,因爲股票在半個十年中下跌了 15%。一些股票的選擇是必須的。回顧 5 年,OGE Energy 的股價和每股收益(EPS)都下降了;EPS 下降速度爲每年 1.1%。EPS 的減少小於股票價格每年下降 3% 的幅度。這意味着市場以前對該股票過於樂觀。
With the stock having lost 3.6% in the past week, it's worth taking a look at business performance and seeing if there's any red flags.
由於股票在過去一週中下跌了 3.6%,因此值得關注業務表現,看看是否存在任何紅旗。
There is no denying that markets are sometimes efficient, but prices do not always reflect underlying business performance. One imperfect but simple way to consider how the market perception of a company has shifted is to compare the change in the earnings per share (EPS) with the share price movement.
不可否認的是,市場有時是高效的,但價格並不總是反映潛在的商業表現。一個不完美但簡單的方法來考慮公司市場感知如何改變是比較每股收益(EPS)變化和股價變動。
Looking back five years, both OGE Energy's share price and EPS declined; the latter at a rate of 1.1% per year. This reduction in EPS is less than the 3% annual reduction in the share price. This implies that the market was previously too optimistic about the stock.
回顧過去五年,OGE Energy 的股價和每股收益(EPS)都下降了;EPS 下降速度爲每年 1.1%。EPS 的減少小於股票價格每年下降 3% 的幅度。這意味着市場以前對該股票過於樂觀。
The graphic below depicts how EPS has changed over time (unveil the exact values by clicking on the image).
下圖顯示了EPS隨時間變化的情況(點擊圖像以顯示確切值)。
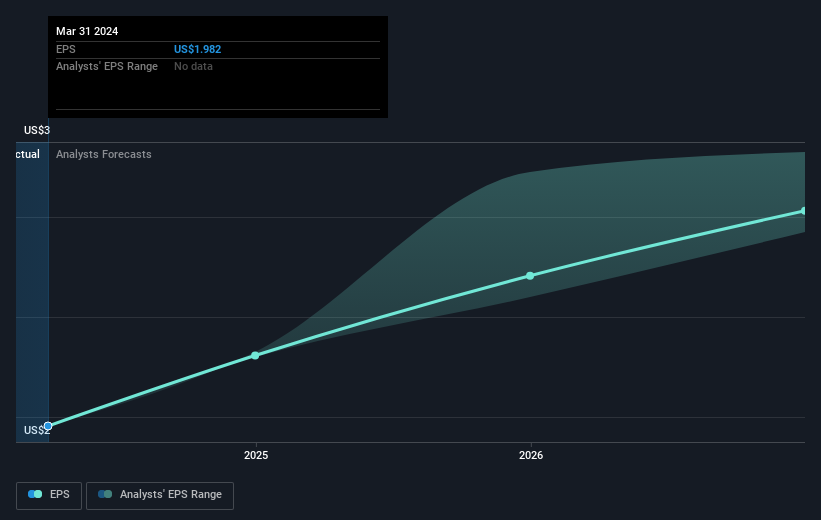
Dive deeper into OGE Energy's key metrics by checking this interactive graph of OGE Energy's earnings, revenue and cash flow.
通過查看 OGE Energy 的收益、營業收入和現金流的交互圖深入了解 OGE Energy 的關鍵指標。
What About Dividends?
那麼分紅怎麼樣呢?
When looking at investment returns, it is important to consider the difference between total shareholder return (TSR) and share price return. The TSR is a return calculation that accounts for the value of cash dividends (assuming that any dividend received was reinvested) and the calculated value of any discounted capital raisings and spin-offs. So for companies that pay a generous dividend, the TSR is often a lot higher than the share price return. As it happens, OGE Energy's TSR for the last 5 years was 6.0%, which exceeds the share price return mentioned earlier. This is largely a result of its dividend payments!
在考慮投資回報時,重要的是考慮總股東回報(TSR)和股票回報之間的差異。 TSR包括任何剝離或折讓的資本籌集(基於股息被重新投資的假設),以及任何股息。因此,對於支付慷慨的股息公司而言,TSR通常比股票回報高得多。就中國神威藥業集團而言,其TSR在過去5年中達到了75%。這超過了我們之前提到的股票回報。該公司支付的股息已經提高了總股東回報。總股東回報和股票回報TSR 是一種考慮到現金分紅(假設收到的任何分紅都被再投資)以及任何折扣後的資本籌集和剝離的計算價值的回報計算。因此,對於支付慷慨的分紅的公司,TSR 往往比股票回報要高得多。碰巧,過去 5 年 OGE Energy 的 TSR 爲 6.0%,超過了先前提到的股票回報。這在很大程度上是其分紅支付的結果!
A Different Perspective
不同的觀點
OGE Energy shareholders are up 7.0% for the year (even including dividends). But that was short of the market average. The silver lining is that the gain was actually better than the average annual return of 1.2% per year over five year. It is possible that returns will improve along with the business fundamentals. It's always interesting to track share price performance over the longer term. But to understand OGE Energy better, we need to consider many other factors. Consider for instance, the ever-present spectre of investment risk. We've identified 2 warning signs with OGE Energy (at least 1 which is a bit unpleasant) , and understanding them should be part of your investment process.
OGE Energy 的股東在今年上漲了 7.0%(包括分紅)。但是,這還不及市場平均水平。好消息是,這個漲幅實際上比過去五年每年平均回報率 1.2% 要好。收益有可能隨着業務基本面的改善而提高。了解 OGE Energy 的更多因素非常有趣。考慮到投資風險的普遍存在,考慮到 OGE Energy 的 2 個警告標誌(其中至少有一個有點不愉快),理解它們應該是您的投資過程的一部分。
If you like to buy stocks alongside management, then you might just love this free list of companies. (Hint: many of them are unnoticed AND have attractive valuation).
如果您喜歡與管理層一起購買股票,那麼您可能會喜歡這個公司的免費列表。 (提示:其中許多公司不爲人注意且具有吸引力的估值。)
Please note, the market returns quoted in this article reflect the market weighted average returns of stocks that currently trade on American exchanges.
請注意,本文所引述的市場回報反映了目前在美國交易所上市的股票的市場加權平均回報。
Have feedback on this article? Concerned about the content? Get in touch with us directly. Alternatively, email editorial-team (at) simplywallst.com.
This article by Simply Wall St is general in nature. We provide commentary based on historical data and analyst forecasts only using an unbiased methodology and our articles are not intended to be financial advice. It does not constitute a recommendation to buy or sell any stock, and does not take account of your objectives, or your financial situation. We aim to bring you long-term focused analysis driven by fundamental data. Note that our analysis may not factor in the latest price-sensitive company announcements or qualitative material. Simply Wall St has no position in any stocks mentioned.
對本文有反饋?關於內容有所顧慮?直接和我們聯繫。或者,發送電子郵件至editorial-team (at) simplywallst.com。
這篇文章是Simply Wall St的一般性文章。我們根據歷史數據和分析師預測提供評論,只使用公正的方法論,我們的文章並不意味着提供任何金融建議。文章不構成買賣任何股票的建議,也不考慮您的目標或您的財務狀況。我們的目標是帶給您基本數據驅動的長期關注分析。請注意,我們的分析可能不考慮最新的價格敏感公司公告或定性材料。Simply Wall St沒有任何股票頭寸。
譯文內容由第三人軟體翻譯。
