
Slowing Rates Of Return At Hologic (NASDAQ:HOLX) Leave Little Room For Excitement
Slowing Rates Of Return At Hologic (NASDAQ:HOLX) Leave Little Room For Excitement
 0.12 = US$903m ÷ (US$8.7b - US$955m) (Based on the trailing twelve months to March 2024).
If you're looking for a multi-bagger, there's a few things to keep an eye out for. Ideally, a business will show two trends; firstly a growing return on capital employed (ROCE) and secondly, an increasing amount of capital employed. Basically this means that a company has profitable initiatives that it can continue to reinvest in, which is a trait of a compounding machine. So, when we ran our eye over Hologic's (NASDAQ:HOLX) trend of ROCE, we liked what we saw.
如果你正在尋找一個multi-bagger,有一些事情要注意。理想情況下,一家公司會顯示兩個趨勢; 首先是不斷增長的資本投入。如果你看到這一點,通常意味着這是一家擁有出色商業模式和大量盈利再投資機會的公司。因此,在這一點上,電科網安(深圳證券交易所:002268)在資本回報趨勢方面似乎相當有前途。資產回報率:它是什麼?資本使用率回報(ROCE)是什麼?數量基本上這意味着公司有盈利的項目,可以繼續投資,這是複合機器的特點。因此,當我們對Hologic(納斯達克:HOLX)的ROCE趨勢進行了審核時,我們喜歡看到的是。
Return On Capital Employed (ROCE): What Is It?
資本僱用回報率(ROCE)是什麼?
If you haven't worked with ROCE before, it measures the 'return' (pre-tax profit) a company generates from capital employed in its business. Analysts use this formula to calculate it for Hologic:
如果您以前沒有使用ROCE,請注意,它衡量公司從其業務中使用的資本獲得的“回報”(稅前利潤)。分析師使用此公式計算Hologic的ROCE:
Return on Capital Employed = Earnings Before Interest and Tax (EBIT) ÷ (Total Assets - Current Liabilities)
資本僱用回報率=利息和稅前收益(EBIT)÷(總資產-流動負債)
0.12 = US$903m ÷ (US$8.7b - US$955m) (Based on the trailing twelve months to March 2024).
0.12= 9.03億美元 ÷ (87億美元 - 9.55億美元)在Elevance Health上,我們已經注意到的趨勢是相當令人放心的。數據顯示,過去五年資產回報率大幅提高至15%。投資所用資產的規模也增加了30%。這表明有很多機會進行內部資本投資,並以更高的速度不斷增長,這種組合在多倍增長方面很常見。.
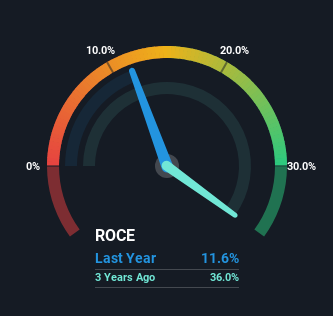
Thus, Hologic has an ROCE of 12%. That's a relatively normal return on capital, and it's around the 10% generated by the Medical Equipment industry.
因此,Hologic的ROCE爲12%。這是一個相對正常的資本回報率,與醫療設備行業產生的10%左右相近。
In the above chart we have measured Hologic's prior ROCE against its prior performance, but the future is arguably more important. If you'd like to see what analysts are forecasting going forward, you should check out our free analyst report for Hologic .
在上圖中,我們測量了Hologic之前的ROCE與其之前的表現,但未來可能更加重要。如果您想了解分析師未來的預測,可以查看我們爲Hologic提供的免費分析師報告。
The Trend Of ROCE
當尋找下一個倍增器時,如果您不確定從哪裏開始,請關注幾個關鍵趨勢。首先,我們希望看到一個經過驗證的資本使用率。如果您看到這一點,通常意味着這是一家擁有出色業務模式和大量盈利再投資機會的公司。然而,調查蒙托克可再生能源公司(NASDAQ:MNTK)後,我們認爲它的現行趨勢不符合倍增器的模式。
While the current returns on capital are decent, they haven't changed much. Over the past five years, ROCE has remained relatively flat at around 12% and the business has deployed 42% more capital into its operations. Since 12% is a moderate ROCE though, it's good to see a business can continue to reinvest at these decent rates of return. Over long periods of time, returns like these might not be too exciting, but with consistency they can pay off in terms of share price returns.
儘管現在的資本回報率不錯,但它們沒有改變太多。在過去的五年中,ROCE保持在約12%的相對穩定水平,業務向其運營投入了42%的更多資本。由於12%是一箇中等的ROCE,因此看到企業可以以這種不錯的回報率繼續重新投資是好的。在長時間段內,這些回報可能不太令人興奮,但是隨着穩定性,它們可以在股價回報方面得到回報。
The Bottom Line On Hologic's ROCE
關於Hologic的ROCE底線
The main thing to remember is that Hologic has proven its ability to continually reinvest at respectable rates of return. Therefore it's no surprise that shareholders have earned a respectable 67% return if they held over the last five years. So while the positive underlying trends may be accounted for by investors, we still think this stock is worth looking into further.
最重要的是,Hologic已經證明了其能夠以可觀的回報率不斷重投資。因此,如果股東在過去的五年中持有,他們賺取了可觀的67%回報率,這不足爲奇。因此,儘管積極的基本趨勢可能已被投資者考慮,但我們仍然認爲這支股票值得進一步研究。
One more thing to note, we've identified 2 warning signs with Hologic and understanding them should be part of your investment process.
還要注意的一件事是,我們已經確定了Hologic的2個警示信號,並了解它們應該成爲您投資過程的一部分。
If you want to search for solid companies with great earnings, check out this free list of companies with good balance sheets and impressive returns on equity.
如果您想尋找財務狀況良好、回報卓越的實力強企業,可以免費查看以下公司列表。
Have feedback on this article? Concerned about the content? Get in touch with us directly. Alternatively, email editorial-team (at) simplywallst.com.
This article by Simply Wall St is general in nature. We provide commentary based on historical data and analyst forecasts only using an unbiased methodology and our articles are not intended to be financial advice. It does not constitute a recommendation to buy or sell any stock, and does not take account of your objectives, or your financial situation. We aim to bring you long-term focused analysis driven by fundamental data. Note that our analysis may not factor in the latest price-sensitive company announcements or qualitative material. Simply Wall St has no position in any stocks mentioned.
對本文有反饋?關於內容有所顧慮?直接和我們聯繫。或者,發送電子郵件至editorial-team (at) simplywallst.com。
這篇文章是Simply Wall St的一般性文章。我們根據歷史數據和分析師預測提供評論,只使用公正的方法論,我們的文章並不意味着提供任何金融建議。文章不構成買賣任何股票的建議,也不考慮您的目標或您的財務狀況。我們的目標是帶給您基本數據驅動的長期關注分析。請注意,我們的分析可能不考慮最新的價格敏感公司公告或定性材料。Simply Wall St沒有任何股票頭寸。
譯文內容由第三人軟體翻譯。