
A10 Networks (NYSE:ATEN) Shareholders Are Still up 163% Over 5 Years Despite Pulling Back 8.1% in the Past Week
A10 Networks (NYSE:ATEN) Shareholders Are Still up 163% Over 5 Years Despite Pulling Back 8.1% in the Past Week
 During the five years of share price growth, A10 Networks moved from a loss to profitability. That kind of transition can be an inflection point that justifies a strong share price gain, just as we have seen here. Since the company was unprofitable five years ago, but not three years ago, it's worth taking a look at the returns in the last three years, too. Indeed, the A10 Networks share price has gained 55% in three years. During the same period, EPS grew by 32% each year. This EPS growth is higher than the 16% average annual increase in the share price over the same three years. Therefore, it seems the market has moderated its expectations for growth, somewhat.
 The worst result, after buying shares in a company (assuming no leverage), would be if you lose all the money you put in. But on a lighter note, a good company can see its share price rise well over 100%. One great example is A10 Networks, Inc. (NYSE:ATEN) which saw its share price drive 152% higher over five years. It's also good to see the share price up 14% over the last quarter. The company reported its financial results recently; you can catch up on the latest numbers by reading our company report.
如果您在購買公司股票後(假設沒有槓桿),最糟糕的結果就是虧光了您的投入資金。但好的公司股價可以上漲100%以上。其中一個很好的例子是A10 Networks, Inc.(紐交所:ATEN),其股價在五年內上漲152%。過去一季度的股價上漲14%也是好事。該公司最近公佈了財務報告,您可以閱讀我們的公司報告了解最新的數字。
While this past week has detracted from the company's five-year return, let's look at the recent trends of the underlying business and see if the gains have been in alignment.
雖然過去的一週削弱了公司的五年回報,但讓我們看看業務的最近趨勢,並查看收益是否已對齊。
While the efficient markets hypothesis continues to be taught by some, it has been proven that markets are over-reactive dynamic systems, and investors are not always rational. One imperfect but simple way to consider how the market perception of a company has shifted is to compare the change in the earnings per share (EPS) with the share price movement.
雖然一些人仍然相信有效市場假說,但已經證明市場是過度反應的動態系統,投資者並不總是理性的。一個不完美但簡單的方法來考慮公司市場看法的變化是比較每股收益(EPS)的變化和股價的波動。
During the five years of share price growth, A10 Networks moved from a loss to profitability. That kind of transition can be an inflection point that justifies a strong share price gain, just as we have seen here. Since the company was unprofitable five years ago, but not three years ago, it's worth taking a look at the returns in the last three years, too. Indeed, the A10 Networks share price has gained 55% in three years. During the same period, EPS grew by 32% each year. This EPS growth is higher than the 16% average annual increase in the share price over the same three years. Therefore, it seems the market has moderated its expectations for growth, somewhat.
在股價增長的五年中,A10 Networks從虧損轉爲盈利。這種轉變可能是一個拐點,證明了強勁的股價上漲,就像我們在這裏看到的那樣。由於該公司五年前虧損,但三年前不虧損,因此也值得看一下過去三年的回報。事實上,A10 Networks在三年內股價上漲了55%。在同期內,每年每股收益增長了32%。這種EPS增長高於同三年股價平均每年增長16%的增長率。因此,市場似乎已經適度降低了對增長的期望。
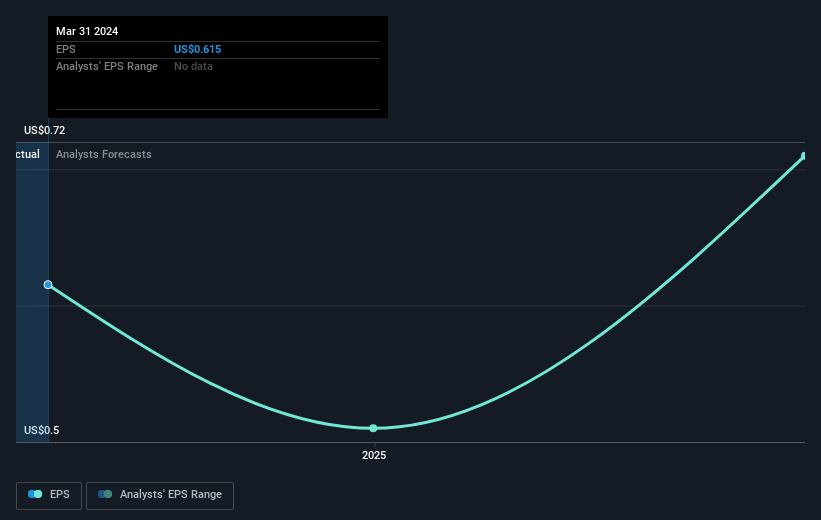
You can see below how EPS has changed over time (discover the exact values by clicking on the image).
下面可以看到每股收益隨時間的變化情況(通過點擊圖像來查看確切數值)。
It is of course excellent to see how A10 Networks has grown profits over the years, but the future is more important for shareholders. It might be well worthwhile taking a look at our free report on how its financial position has changed over time.
A10 Networks 多年來盈利增長令人信服,但未來對於股東來說更爲重要。請看我們免費報告,了解其財務狀況如何隨着時間變化而變化。
What About Dividends?
那麼分紅怎麼樣呢?
When looking at investment returns, it is important to consider the difference between total shareholder return (TSR) and share price return. The TSR is a return calculation that accounts for the value of cash dividends (assuming that any dividend received was reinvested) and the calculated value of any discounted capital raisings and spin-offs. So for companies that pay a generous dividend, the TSR is often a lot higher than the share price return. In the case of A10 Networks, it has a TSR of 163% for the last 5 years. That exceeds its share price return that we previously mentioned. This is largely a result of its dividend payments!
在考慮投資回報時,重要的是考慮總股東回報(TSR)和股票回報之間的差異。 TSR包括任何剝離或折讓的資本籌集(基於股息被重新投資的假設),以及任何股息。因此,對於支付慷慨的股息公司而言,TSR通常比股票回報高得多。就中國神威藥業集團而言,其TSR在過去5年中達到了75%。這超過了我們之前提到的股票回報。該公司支付的股息已經提高了總股東回報。總股東回報和股票回報TSR是一種計算回報的方法,考慮了現金股息(假設任何股息都被再投資)的價值,以及任何折價資本募集和分拆的計算價值。因此,對於付出大量股息的公司,TSR通常比股價回報高得多。在A10 Networks的情況下,過去5年的TSR爲163%。這超過了我們先前提到的股價回報。這主要是其股息支付的結果!
A Different Perspective
不同的觀點
A10 Networks shareholders are up 2.7% for the year (even including dividends). But that return falls short of the market. On the bright side, the longer term returns (running at about 21% a year, over half a decade) look better. It may well be that this is a business worth popping on the watching, given the continuing positive reception, over time, from the market. It's always interesting to track share price performance over the longer term. But to understand A10 Networks better, we need to consider many other factors. Consider risks, for instance. Every company has them, and we've spotted 1 warning sign for A10 Networks you should know about.
即使包括股息,A10 Networks的股東今年的回報率也只有2.7%。但這一回報不及市場。光明的是,長期回報(在半個世紀內大約爲21%)看起來更好。鑑於市場一直對其保持正面評價,這可能是一個值得關注的企業。長期追蹤股價表現總是很有趣。但要更好地了解A10 Networks,我們需要考慮許多其他因素。例如,要考慮風險。每個公司都有他們,我們注意到A10 Networks存在1個警示信號,您應該知道。
But note: A10 Networks may not be the best stock to buy. So take a peek at this free list of interesting companies with past earnings growth (and further growth forecast).
但是請注意:A10 Networks可能不是最好的股票。因此,請瞥一眼過去盈利增長(以及進一步增長預測)的有趣公司免費列表。
Please note, the market returns quoted in this article reflect the market weighted average returns of stocks that currently trade on American exchanges.
請注意,本文所引述的市場回報反映了目前在美國交易所上市的股票的市場加權平均回報。
Have feedback on this article? Concerned about the content? Get in touch with us directly. Alternatively, email editorial-team (at) simplywallst.com.
This article by Simply Wall St is general in nature. We provide commentary based on historical data and analyst forecasts only using an unbiased methodology and our articles are not intended to be financial advice. It does not constitute a recommendation to buy or sell any stock, and does not take account of your objectives, or your financial situation. We aim to bring you long-term focused analysis driven by fundamental data. Note that our analysis may not factor in the latest price-sensitive company announcements or qualitative material. Simply Wall St has no position in any stocks mentioned.
對本文有反饋?關於內容有所顧慮?直接和我們聯繫。或者,發送電子郵件至editorial-team (at) simplywallst.com。
這篇文章是Simply Wall St的一般性文章。我們根據歷史數據和分析師預測提供評論,只使用公正的方法論,我們的文章並不意味着提供任何金融建議。文章不構成買賣任何股票的建議,也不考慮您的目標或您的財務狀況。我們的目標是帶給您基本數據驅動的長期關注分析。請注意,我們的分析可能不考慮最新的價格敏感公司公告或定性材料。Simply Wall St沒有任何股票頭寸。
譯文內容由第三人軟體翻譯。