
Returns On Capital Signal Tricky Times Ahead For Ryerson Holding (NYSE:RYI)
Returns On Capital Signal Tricky Times Ahead For Ryerson Holding (NYSE:RYI)
 0.081 = US$162m ÷ (US$2.7b - US$729m) (Based on the trailing twelve months to March 2024).
There are a few key trends to look for if we want to identify the next multi-bagger. Firstly, we'd want to identify a growing return on capital employed (ROCE) and then alongside that, an ever-increasing base of capital employed. This shows us that it's a compounding machine, able to continually reinvest its earnings back into the business and generate higher returns. Although, when we looked at Ryerson Holding (NYSE:RYI), it didn't seem to tick all of these boxes.
如果想標識下一個幾倍股,就應該注重以下幾個關鍵趨勢。首先,我們需要找出資本使用增長。如果您看到這一點,通常意味着這是一傢俱有出色業務模式和大量盈利再投資機會的公司。說到這一點,我們注意到通用股份(SHSE:601500)的資本回報率有很大變化,讓我們來看一下。資產回報率:它是什麼?資本僱用回報率 (ROCE) 是一種早期趨勢,可以用來識別有可能在長期內翻倍增值的股票,然後在此基礎上,要尋找一個不斷增長的業務板塊和行業板塊。這告訴我們這是一臺複利機器,能夠不斷地將其收益再投入業務,從而產生更高的回報。因此,在這點上,Materialise (納斯達克:MTLS) 看起來相當有前途,因爲它在資本回報方面的趨勢相當不錯。資產回報率 = 利息和所得稅前收益(EBIT)÷(總資產-流動負債)這表明它是一個複合機器,能夠不斷地將盈利再投入到業務中,併產生更高的回報。雖然,在我們看來,Ryerson Holding(紐交所:RYI)似乎沒有完全符合這些要求。
Understanding Return On Capital Employed (ROCE)
上面您可以看到蒙托克可再生能源現行ROCE與之前資本回報的比較,但過去只能知道這麼多。如果您感興趣,可以查看我們免費的蒙托克可再生能源分析師報告,了解分析師的預測。
Just to clarify if you're unsure, ROCE is a metric for evaluating how much pre-tax income (in percentage terms) a company earns on the capital invested in its business. Analysts use this formula to calculate it for Ryerson Holding:
只是爲了明確,如果您不確定,ROCE是評估公司在其業務中投資的資本所獲得的稅前收入(以百分比形式)的指標。分析師使用這個公式爲Ryerson Holding計算它:
Return on Capital Employed = Earnings Before Interest and Tax (EBIT) ÷ (Total Assets - Current Liabilities)
資產僱用回報率(ROCE)是指企業利潤,即企業稅前利潤除以企業投入的總資本(負債加股權)。如果ROCE高於企業財務成本的承受能力,那麼企業就會創造出更多的價值。
0.081 = US$162m ÷ (US$2.7b - US$729m) (Based on the trailing twelve months to March 2024).
0.081 = 美元1.62億 ÷ (27億美元 - 7.29億美元)在Elevance Health上,我們已經注意到的趨勢是相當令人放心的。數據顯示,過去五年資產回報率大幅提高至15%。投資所用資產的規模也增加了30%。這表明有很多機會進行內部資本投資,並以更高的速度不斷增長,這種組合在多倍增長方面很常見。.
Thus, Ryerson Holding has an ROCE of 8.1%. On its own, that's a low figure but it's around the 9.1% average generated by the Metals and Mining industry.
因此,Ryerson Holding的ROCE爲8.1%。單獨來看,這是一個低數字,但與貴金屬和礦業行業產生的平均9.1%左右相當。
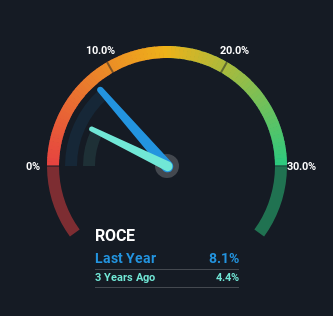
Above you can see how the current ROCE for Ryerson Holding compares to its prior returns on capital, but there's only so much you can tell from the past. If you'd like, you can check out the forecasts from the analysts covering Ryerson Holding for free.
您可以看到Ryerson Holding目前的ROCE與其先前的資本回報相比如何,但是從過去只能得出有限的信息。如果您願意,您可以免費查看覆蓋Ryerson Holding的分析師的預測。
The Trend Of ROCE
當尋找下一個倍增器時,如果您不確定從哪裏開始,請關注幾個關鍵趨勢。首先,我們希望看到一個經過驗證的資本使用率。如果您看到這一點,通常意味着這是一家擁有出色業務模式和大量盈利再投資機會的公司。然而,調查蒙托克可再生能源公司(NASDAQ:MNTK)後,我們認爲它的現行趨勢不符合倍增器的模式。
On the surface, the trend of ROCE at Ryerson Holding doesn't inspire confidence. To be more specific, ROCE has fallen from 11% over the last five years. Given the business is employing more capital while revenue has slipped, this is a bit concerning. This could mean that the business is losing its competitive advantage or market share, because while more money is being put into ventures, it's actually producing a lower return - "less bang for their buck" per se.
在表面上,Ryerson Holding的ROCE趨勢並不令人信心滿滿。更具體地說,ROCE在過去五年中已從11%下降。鑑於企業正在投入更多資本而營業收入卻下降,這有點令人擔憂。這可能意味着企業正在失去其競爭優勢或市場份額,因爲雖然將更多資金投入創業項目,但實際上產生的回報卻更低 - “每筆投資產生的回報更少”。
The Key Takeaway
重要提示
We're a bit apprehensive about Ryerson Holding because despite more capital being deployed in the business, returns on that capital and sales have both fallen. Yet despite these poor fundamentals, the stock has gained a huge 235% over the last five years, so investors appear very optimistic. In any case, the current underlying trends don't bode well for long term performance so unless they reverse, we'd start looking elsewhere.
儘管在業務中投入了更多資本,但銷售和資本回報率都有所下降,我們對Ryerson Holding有些猶豫不決。然而,儘管這些基本面較差,該股票在過去5年中大漲了235%,因此投資者似乎非常樂觀。無論如何,當前的基本趨勢對於長期表現都不是很好,因此除非趨勢發生逆轉,否則我們將開始尋找其他股票。
On a separate note, we've found 4 warning signs for Ryerson Holding you'll probably want to know about.
另外,我們發現了Ryerson Holding的4個警告信號,您可能想知道。
While Ryerson Holding isn't earning the highest return, check out this free list of companies that are earning high returns on equity with solid balance sheets.
雖然Ryerson Holding沒有創造最高回報,但是請查看此免費公司列表,這些公司具有堅實的資產負債表並創造高回報。
Have feedback on this article? Concerned about the content? Get in touch with us directly. Alternatively, email editorial-team (at) simplywallst.com.
This article by Simply Wall St is general in nature. We provide commentary based on historical data and analyst forecasts only using an unbiased methodology and our articles are not intended to be financial advice. It does not constitute a recommendation to buy or sell any stock, and does not take account of your objectives, or your financial situation. We aim to bring you long-term focused analysis driven by fundamental data. Note that our analysis may not factor in the latest price-sensitive company announcements or qualitative material. Simply Wall St has no position in any stocks mentioned.
對本文有反饋?關於內容有所顧慮?直接和我們聯繫。或者,發送電子郵件至editorial-team (at) simplywallst.com。
這篇文章是Simply Wall St的一般性文章。我們根據歷史數據和分析師預測提供評論,只使用公正的方法論,我們的文章並不意味着提供任何金融建議。文章不構成買賣任何股票的建議,也不考慮您的目標或您的財務狀況。我們的目標是帶給您基本數據驅動的長期關注分析。請注意,我們的分析可能不考慮最新的價格敏感公司公告或定性材料。Simply Wall St沒有任何股票頭寸。
譯文內容由第三人軟體翻譯。
