
Weak Financial Prospects Seem To Be Dragging Down Safety Insurance Group, Inc. (NASDAQ:SAFT) Stock
Weak Financial Prospects Seem To Be Dragging Down Safety Insurance Group, Inc. (NASDAQ:SAFT) Stock
With its stock down 9.6% over the past three months, it is easy to disregard Safety Insurance Group (NASDAQ:SAFT). To decide if this trend could continue, we decided to look at its weak fundamentals as they shape the long-term market trends. Particularly, we will be paying attention to Safety Insurance Group's ROE today.
在過去三個月中,其股價下跌了9.6%,很容易忽視安全保險集團(納斯達克股票代碼:SAFT)。爲了決定這種趨勢能否持續下去,我們決定研究其疲軟的基本面,因爲它們塑造了長期市場趨勢。特別是,我們今天將關注安全保險集團的投資回報率。
Return on equity or ROE is a key measure used to assess how efficiently a company's management is utilizing the company's capital. In simpler terms, it measures the profitability of a company in relation to shareholder's equity.
股本回報率或投資回報率是用於評估公司管理層利用公司資本效率的關鍵指標。簡而言之,它衡量公司相對於股東權益的盈利能力。
How Do You Calculate Return On Equity?
你如何計算股本回報率?
Return on equity can be calculated by using the formula:
股本回報率可以使用以下公式計算:
Return on Equity = Net Profit (from continuing operations) ÷ Shareholders' Equity
股本回報率 = 淨利潤(來自持續經營業務)÷ 股東權益
So, based on the above formula, the ROE for Safety Insurance Group is:
因此,根據上述公式,安全保險集團的投資回報率爲:
6.4% = US$51m ÷ US$807m (Based on the trailing twelve months to March 2024).
6.4% = 5100萬美元 ÷ 8.07億美元(基於截至2024年3月的過去十二個月)。
The 'return' refers to a company's earnings over the last year. So, this means that for every $1 of its shareholder's investments, the company generates a profit of $0.06.
“回報” 是指公司去年的收益。因此,這意味着公司每向股東投資1美元,就會產生0.06美元的利潤。
What Is The Relationship Between ROE And Earnings Growth?
投資回報率與收益增長之間有什麼關係?
So far, we've learned that ROE is a measure of a company's profitability. We now need to evaluate how much profit the company reinvests or "retains" for future growth which then gives us an idea about the growth potential of the company. Assuming everything else remains unchanged, the higher the ROE and profit retention, the higher the growth rate of a company compared to companies that don't necessarily bear these characteristics.
到目前爲止,我們已經了解到,投資回報率是衡量公司盈利能力的指標。現在,我們需要評估公司再投資或 “保留” 了多少利潤以用於未來的增長,從而使我們對公司的增長潛力有所了解。假設其他一切保持不變,那麼與不一定具有這些特徵的公司相比,投資回報率和利潤保留率越高,公司的增長率就越高。
Safety Insurance Group's Earnings Growth And 6.4% ROE
安全保險集團的收益增長和6.4%的投資回報率
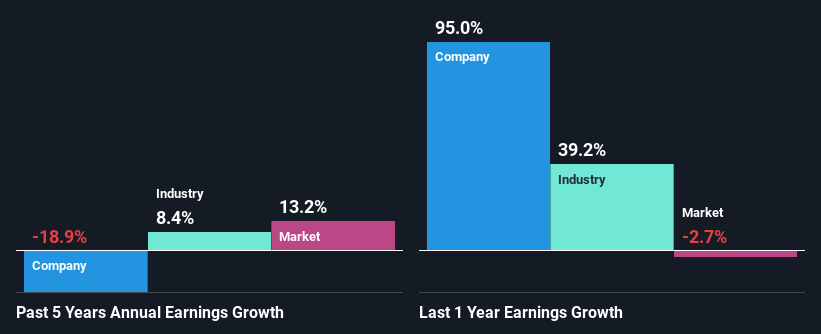
On the face of it, Safety Insurance Group's ROE is not much to talk about. Next, when compared to the average industry ROE of 13%, the company's ROE leaves us feeling even less enthusiastic. For this reason, Safety Insurance Group's five year net income decline of 19% is not surprising given its lower ROE. We believe that there also might be other aspects that are negatively influencing the company's earnings prospects. For example, it is possible that the business has allocated capital poorly or that the company has a very high payout ratio.
從表面上看,安全保險集團的投資回報率沒什麼好談的。接下來,與13%的行業平均投資回報率相比,該公司的投資回報率使我們感到不那麼熱情。出於這個原因,鑑於其投資回報率較低,安全保險集團五年淨收入下降19%並不奇怪。我們認爲,可能還有其他方面對公司的盈利前景產生負面影響。例如,企業的資本分配可能不力,或者公司的派息率很高。
However, when we compared Safety Insurance Group's growth with the industry we found that while the company's earnings have been shrinking, the industry has seen an earnings growth of 8.4% in the same period. This is quite worrisome.
但是,當我們將安全保險集團的增長與該行業的增長進行比較時,我們發現,儘管該公司的收益一直在萎縮,但該行業同期的收益增長了8.4%。這非常令人擔憂。
Earnings growth is an important metric to consider when valuing a stock. It's important for an investor to know whether the market has priced in the company's expected earnings growth (or decline). Doing so will help them establish if the stock's future looks promising or ominous. If you're wondering about Safety Insurance Group's's valuation, check out this gauge of its price-to-earnings ratio, as compared to its industry.
收益增長是對股票進行估值時要考慮的重要指標。對於投資者來說,重要的是要知道市場是否對公司的預期收益增長(或下降)進行了定價。這樣做將幫助他們確定股票的未來是樂觀還是不祥的。如果你想知道安全保險集團的估值,可以看看這個衡量其市盈率與行業相比的指標。
Is Safety Insurance Group Using Its Retained Earnings Effectively?
安全保險集團是否有效地使用其留存收益?
Safety Insurance Group's declining earnings is not surprising given how the company is spending most of its profits in paying dividends, judging by its three-year median payout ratio of 96% (or a retention ratio of 3.8%). With only a little being reinvested into the business, earnings growth would obviously be low or non-existent. You can see the 2 risks we have identified for Safety Insurance Group by visiting our risks dashboard for free on our platform here.
鑑於Safety Insurance Group將大部分利潤用於支付股息,其三年派息率中位數爲96%(或3.8%的留存率)來看,該集團收益的下降並不奇怪。由於只有一小部分被再投資到該業務,收益增長顯然會很低或根本不存在。您可以訪問我們的安全保險集團查看我們爲安全保險集團確定的兩種風險 風險儀表板 在我們的平台上免費使用。
Moreover, Safety Insurance Group has been paying dividends for at least ten years or more suggesting that management must have perceived that the shareholders prefer dividends over earnings growth.
此外,安全保險集團派發股息已有至少十年或更長時間,這表明管理層一定已經意識到股東更喜歡分紅而不是收益增長。
Summary
摘要
Overall, we would be extremely cautious before making any decision on Safety Insurance Group. Specifically, it has shown quite an unsatisfactory performance as far as earnings growth is concerned, and a poor ROE and an equally poor rate of reinvestment seem to be the reason behind this inadequate performance. Up till now, we've only made a short study of the company's growth data. To gain further insights into Safety Insurance Group's past profit growth, check out this visualization of past earnings, revenue and cash flows.
總體而言,在就安全保險集團做出任何決定之前,我們將非常謹慎。具體而言,就收益增長而言,它的表現相當不令人滿意,而糟糕的投資回報率和同樣糟糕的再投資率似乎是表現不佳的原因。到目前爲止,我們只對公司的增長數據進行了簡短的研究。要進一步了解安全保險集團過去的利潤增長,請查看此前收益、收入和現金流的可視化。
Have feedback on this article? Concerned about the content? Get in touch with us directly. Alternatively, email editorial-team (at) simplywallst.com.
This article by Simply Wall St is general in nature. We provide commentary based on historical data and analyst forecasts only using an unbiased methodology and our articles are not intended to be financial advice. It does not constitute a recommendation to buy or sell any stock, and does not take account of your objectives, or your financial situation. We aim to bring you long-term focused analysis driven by fundamental data. Note that our analysis may not factor in the latest price-sensitive company announcements or qualitative material. Simply Wall St has no position in any stocks mentioned.
對這篇文章有反饋嗎?對內容感到擔憂?直接聯繫我們。 或者,給編輯團隊 (at) simplywallst.com 發送電子郵件。
Simply Wall St的這篇文章本質上是籠統的。我們僅使用公正的方法根據歷史數據和分析師的預測提供評論,我們的文章無意作爲財務建議。它不構成買入或賣出任何股票的建議,也沒有考慮到您的目標或財務狀況。我們的目標是爲您提供由基本數據驅動的長期重點分析。請注意,我們的分析可能不考慮最新的價格敏感型公司公告或定性材料。簡而言之,華爾街沒有持有任何上述股票的頭寸。
譯文內容由第三人軟體翻譯。