
Further Weakness as Hanesbrands (NYSE:HBI) Drops 3.5% This Week, Taking Three-year Losses to 73%
Further Weakness as Hanesbrands (NYSE:HBI) Drops 3.5% This Week, Taking Three-year Losses to 73%
As an investor, mistakes are inevitable. But you have a problem if you face massive losses more than once in a while. So spare a thought for the long term shareholders of Hanesbrands Inc. (NYSE:HBI); the share price is down a whopping 75% in the last three years. That would certainly shake our confidence in the decision to own the stock.
作爲投資者,錯誤是不可避免的。但是,如果你不止一次地面臨巨額損失,你就會遇到問題。因此,不用考慮Hanesbrands Inc.(紐約證券交易所代碼:HBI)的長期股東;股價在過去三年中下跌了75%。這肯定會動搖我們對擁有該股決定的信心。
With the stock having lost 3.5% in the past week, it's worth taking a look at business performance and seeing if there's any red flags.
由於該股在過去一週下跌了3.5%,值得一看業務表現,看看是否有任何危險信號。
To quote Buffett, 'Ships will sail around the world but the Flat Earth Society will flourish. There will continue to be wide discrepancies between price and value in the marketplace...' One way to examine how market sentiment has changed over time is to look at the interaction between a company's share price and its earnings per share (EPS).
引用巴菲特的話說:“船隻將在世界各地航行,但Flat Earth Society將蓬勃發展。市場上的價格和價值之間將繼續存在巨大差異...”研究市場情緒如何隨着時間的推移而變化的一種方法是研究公司股價與其每股收益(EPS)之間的相互作用。
Hanesbrands has made a profit in the past. On the other hand, it reported a trailing twelve months loss, suggesting it isn't reliably profitable. Other metrics may better explain the share price move.
Hanesbrands過去曾盈利。另一方面,它報告了過去十二個月的虧損,這表明它無法可靠地盈利。其他指標可以更好地解釋股價走勢。
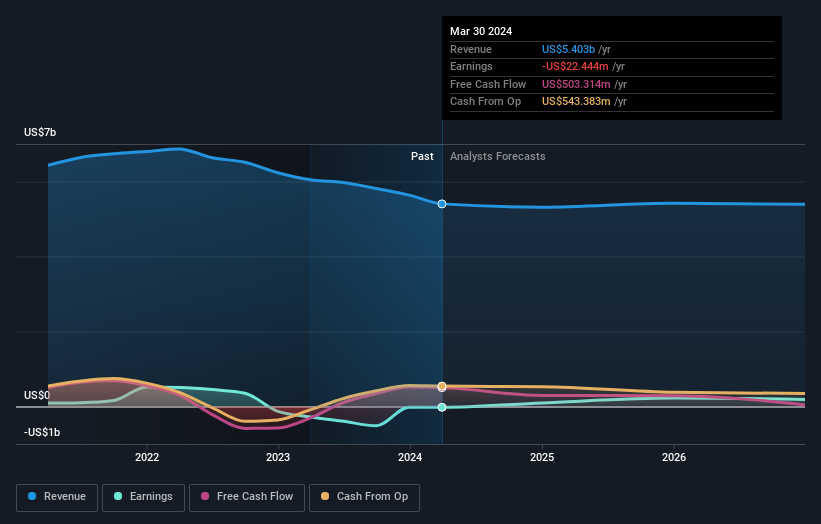
We think that the revenue decline over three years, at a rate of 6.8% per year, probably had some shareholders looking to sell. And that's not surprising, since it seems unlikely that EPS growth can continue for long in the absence of revenue growth.
我們認爲,三年來的收入以每年6.8%的速度下降,可能促使一些股東想要出售。這並不奇怪,因爲在收入沒有增長的情況下,每股收益的增長似乎不太可能持續很長時間。
The company's revenue and earnings (over time) are depicted in the image below (click to see the exact numbers).
公司的收入和收益(隨着時間的推移)如下圖所示(點擊查看確切數字)。
If you are thinking of buying or selling Hanesbrands stock, you should check out this FREE detailed report on its balance sheet.
如果您正在考慮買入或賣出Hanesbrands的股票,則應查看其資產負債表上的免費詳細報告。
A Different Perspective
不同的視角
Hanesbrands shareholders have received returns of 26% over twelve months, which isn't far from the general market return. The silver lining is that the share price is up in the short term, which flies in the face of the annualised loss of 10% over the last five years. We're pretty skeptical of turnaround stories, but it's good to see the recent share price recovery. I find it very interesting to look at share price over the long term as a proxy for business performance. But to truly gain insight, we need to consider other information, too. Take risks, for example - Hanesbrands has 1 warning sign we think you should be aware of.
Hanesbrands的股東在十二個月內獲得了26%的回報,這與總體市場回報率相差不遠。一線希望是,股價在短期內上漲,這與過去五年10%的年化虧損背道而馳。我們對轉機故事持懷疑態度,但很高興看到最近的股價回升。我發現將長期股價視爲業務績效的代表非常有趣。但是,要真正獲得見解,我們還需要考慮其他信息。例如,冒險吧——Hanesbrands有1個警告信號,我們認爲你應該注意。
Of course Hanesbrands may not be the best stock to buy. So you may wish to see this free collection of growth stocks.
當然,Hanesbrands可能不是最值得購買的股票。因此,您可能希望看到這批免費的成長股。
Please note, the market returns quoted in this article reflect the market weighted average returns of stocks that currently trade on American exchanges.
請注意,本文引用的市場回報反映了目前在美國交易所交易的股票的市場加權平均回報。
Have feedback on this article? Concerned about the content? Get in touch with us directly. Alternatively, email editorial-team (at) simplywallst.com.
This article by Simply Wall St is general in nature. We provide commentary based on historical data and analyst forecasts only using an unbiased methodology and our articles are not intended to be financial advice. It does not constitute a recommendation to buy or sell any stock, and does not take account of your objectives, or your financial situation. We aim to bring you long-term focused analysis driven by fundamental data. Note that our analysis may not factor in the latest price-sensitive company announcements or qualitative material. Simply Wall St has no position in any stocks mentioned.
對這篇文章有反饋嗎?對內容感到擔憂?直接聯繫我們。 或者,給編輯團隊 (at) simplywallst.com 發送電子郵件。
Simply Wall St的這篇文章本質上是籠統的。我們僅使用公正的方法根據歷史數據和分析師的預測提供評論,我們的文章無意作爲財務建議。它不構成買入或賣出任何股票的建議,也沒有考慮到您的目標或財務狀況。我們的目標是爲您提供由基本數據驅動的長期重點分析。請注意,我們的分析可能不考慮最新的價格敏感型公司公告或定性材料。簡而言之,華爾街沒有持有任何上述股票的頭寸。
譯文內容由第三人軟體翻譯。