
Arch Capital Group's (NASDAQ:ACGL) Five-year Earnings Growth Trails the Solid Shareholder Returns
Arch Capital Group's (NASDAQ:ACGL) Five-year Earnings Growth Trails the Solid Shareholder Returns
When you buy shares in a company, it's worth keeping in mind the possibility that it could fail, and you could lose your money. But when you pick a company that is really flourishing, you can make more than 100%. Long term Arch Capital Group Ltd. (NASDAQ:ACGL) shareholders would be well aware of this, since the stock is up 200% in five years. It's also good to see the share price up 20% over the last quarter. This could be related to the recent financial results, released recently - you can catch up on the most recent data by reading our company report.
購買股票的時候,應該牢記公司可能失敗,導致你損失資本。但是當你選擇一個真正繁榮的公司,你可以獲得超過100%的回報。獲得100%以上的利潤。長揸納斯達克ACGL的股票的股東們,會明顯注意到,在過去的五年裏,該股票上漲了200%。過去一個季度,股價上漲了20%,這也是個好消息。這可能與最近公佈的財務業績有關,你可以通過閱讀我們的公司報告來了解最新的數據。
After a strong gain in the past week, it's worth seeing if longer term returns have been driven by improving fundamentals.
在過去的一週之內,獲得的強勁收益是否表明了長期回報受到基本面的推動值得關注。
There is no denying that markets are sometimes efficient, but prices do not always reflect underlying business performance. One imperfect but simple way to consider how the market perception of a company has shifted is to compare the change in the earnings per share (EPS) with the share price movement.
不可否認的是,市場有時是高效的,但價格並不總是反映潛在的商業表現。一個不完美但簡單的方法來考慮公司市場感知如何改變是比較每股收益(EPS)變化和股價變動。
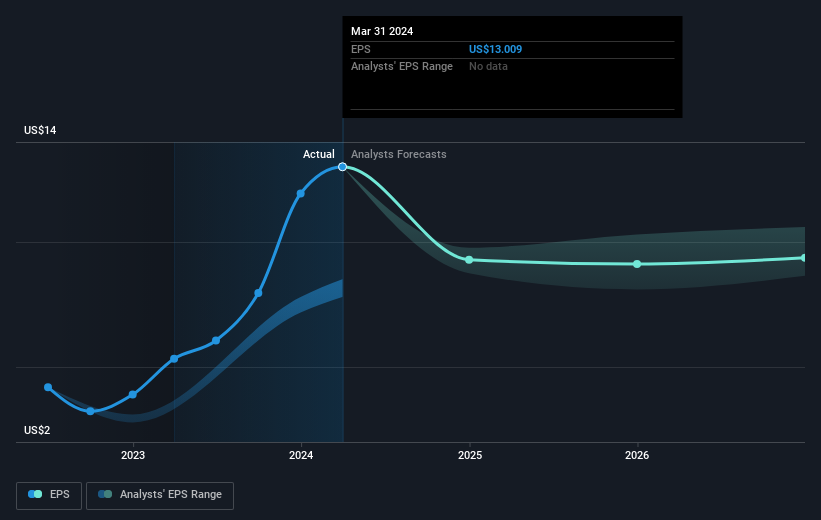
During five years of share price growth, Arch Capital Group achieved compound earnings per share (EPS) growth of 39% per year. This EPS growth is higher than the 25% average annual increase in the share price. So it seems the market isn't so enthusiastic about the stock these days. This cautious sentiment is reflected in its (fairly low) P/E ratio of 7.99.
在過去五年的股價增長中,Arch Capital Group在每股收益上實現了39%的複合增長。該EPS增長高於股價25%的平均每年增長率。因此,目前市場對該股票並沒有那麼熱情,這種謹慎的情緒反映在其(相當低的)市盈率爲7.99上。你可以查看下面的圖表,了解EPS隨時間的變化(點擊圖像以查看確切數值)。
You can see below how EPS has changed over time (discover the exact values by clicking on the image).
下面可以看到每股收益隨時間的變化情況(通過點擊圖像來查看確切數值)。
We know that Arch Capital Group has improved its bottom line over the last three years, but what does the future have in store? It might be well worthwhile taking a look at our free report on how its financial position has changed over time.
我們知道Arch Capital Group在過去三年裏改善了其底線,但未來會有什麼變化呢?值得一看的是我們的免費報告,它詳細介紹了該公司財務狀況的變化。
A Different Perspective
不同的觀點
We're pleased to report that Arch Capital Group shareholders have received a total shareholder return of 43% over one year. That gain is better than the annual TSR over five years, which is 25%. Therefore it seems like sentiment around the company has been positive lately. Someone with an optimistic perspective could view the recent improvement in TSR as indicating that the business itself is getting better with time. It's always interesting to track share price performance over the longer term. But to understand Arch Capital Group better, we need to consider many other factors. Even so, be aware that Arch Capital Group is showing 2 warning signs in our investment analysis , and 1 of those makes us a bit uncomfortable...
我們很高興地報告,Arch Capital Group的股東在一年內獲得了43%的股票回報。這一增長優於過去五年的平均年回報率25%。因此,公司近期的情緒看起來是正面的。持有樂觀的態度的人可能會認爲,TSR的最近改善表明該業務本身正在逐漸惡化。跟蹤股價長期趨勢總是很有趣的。但是爲了更好地了解Arch Capital Group,我們需要考慮許多其他因素。即使如此,請注意,我們的投資分析顯示Arch Capital Group存在2個警告信號,其中1個讓我們感到有些不安......
Of course Arch Capital Group may not be the best stock to buy. So you may wish to see this free collection of growth stocks.
當然,Arch Capital Group可能不是最好的股票,因此,你可能希望查看此“增長股票”的免費收藏。
Please note, the market returns quoted in this article reflect the market weighted average returns of stocks that currently trade on American exchanges.
請注意,本文所引述的市場回報反映了目前在美國交易所上市的股票的市場加權平均回報。
Have feedback on this article? Concerned about the content? Get in touch with us directly. Alternatively, email editorial-team (at) simplywallst.com.
This article by Simply Wall St is general in nature. We provide commentary based on historical data and analyst forecasts only using an unbiased methodology and our articles are not intended to be financial advice. It does not constitute a recommendation to buy or sell any stock, and does not take account of your objectives, or your financial situation. We aim to bring you long-term focused analysis driven by fundamental data. Note that our analysis may not factor in the latest price-sensitive company announcements or qualitative material. Simply Wall St has no position in any stocks mentioned.
對本文有反饋?關於內容有所顧慮?直接和我們聯繫。或者,發送電子郵件至editorial-team (at) simplywallst.com。
這篇文章是Simply Wall St的一般性文章。我們根據歷史數據和分析師預測提供評論,只使用公正的方法論,我們的文章並不意味着提供任何金融建議。文章不構成買賣任何股票的建議,也不考慮您的目標或您的財務狀況。我們的目標是帶給您基本數據驅動的長期關注分析。請注意,我們的分析可能不考慮最新的價格敏感公司公告或定性材料。Simply Wall St沒有任何股票頭寸。
譯文內容由第三人軟體翻譯。