
Key Insights
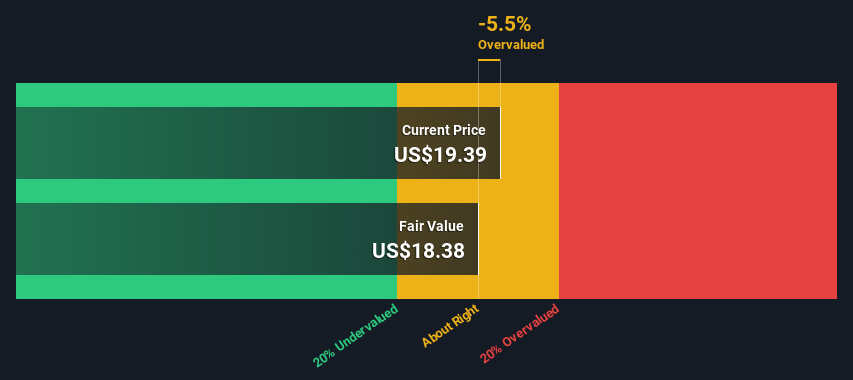
- Using the 2 Stage Free Cash Flow to Equity, Kinder Morgan fair value estimate is US$18.38
- With US$19.39 share price, Kinder Morgan appears to be trading close to its estimated fair value
- The US$20.53 analyst price target for KMI is 12% more than our estimate of fair value
Today we'll do a simple run through of a valuation method used to estimate the attractiveness of Kinder Morgan, Inc. (NYSE:KMI) as an investment opportunity by taking the expected future cash flows and discounting them to today's value. This will be done using the Discounted Cash Flow (DCF) model. Before you think you won't be able to understand it, just read on! It's actually much less complex than you'd imagine.
Remember though, that there are many ways to estimate a company's value, and a DCF is just one method. Anyone interested in learning a bit more about intrinsic value should have a read of the Simply Wall St analysis model.
What's The Estimated Valuation?
We're using the 2-stage growth model, which simply means we take in account two stages of company's growth. In the initial period the company may have a higher growth rate and the second stage is usually assumed to have a stable growth rate. In the first stage we need to estimate the cash flows to the business over the next ten years. Where possible we use analyst estimates, but when these aren't available we extrapolate the previous free cash flow (FCF) from the last estimate or reported value. We assume companies with shrinking free cash flow will slow their rate of shrinkage, and that companies with growing free cash flow will see their growth rate slow, over this period. We do this to reflect that growth tends to slow more in the early years than it does in later years.
A DCF is all about the idea that a dollar in the future is less valuable than a dollar today, so we need to discount the sum of these future cash flows to arrive at a present value estimate:
10-year free cash flow (FCF) estimate
| 2024 | 2025 | 2026 | 2027 | 2028 | 2029 | 2030 | 2031 | 2032 | 2033 | |
| Levered FCF ($, Millions) | US$2.46b | US$3.36b | US$3.65b | US$3.95b | US$3.23b | US$3.25b | US$3.28b | US$3.33b | US$3.39b | US$3.46b |
| Growth Rate Estimate Source | Analyst x2 | Analyst x5 | Analyst x3 | Analyst x2 | Analyst x1 | Est @ 0.56% | Est @ 1.10% | Est @ 1.49% | Est @ 1.75% | Est @ 1.94% |
| Present Value ($, Millions) Discounted @ 9.5% | US$2.2k | US$2.8k | US$2.8k | US$2.7k | US$2.1k | US$1.9k | US$1.7k | US$1.6k | US$1.5k | US$1.4k |
("Est" = FCF growth rate estimated by Simply Wall St)
Present Value of 10-year Cash Flow (PVCF) = US$21b
The second stage is also known as Terminal Value, this is the business's cash flow after the first stage. For a number of reasons a very conservative growth rate is used that cannot exceed that of a country's GDP growth. In this case we have used the 5-year average of the 10-year government bond yield (2.4%) to estimate future growth. In the same way as with the 10-year 'growth' period, we discount future cash flows to today's value, using a cost of equity of 9.5%.
Terminal Value (TV)= FCF2033 × (1 + g) ÷ (r – g) = US$3.5b× (1 + 2.4%) ÷ (9.5%– 2.4%) = US$50b
Present Value of Terminal Value (PVTV)= TV / (1 + r)10= US$50b÷ ( 1 + 9.5%)10= US$20b
The total value is the sum of cash flows for the next ten years plus the discounted terminal value, which results in the Total Equity Value, which in this case is US$41b. In the final step we divide the equity value by the number of shares outstanding. Relative to the current share price of US$19.4, the company appears around fair value at the time of writing. Remember though, that this is just an approximate valuation, and like any complex formula - garbage in, garbage out.
The Assumptions
The calculation above is very dependent on two assumptions. The first is the discount rate and the other is the cash flows. Part of investing is coming up with your own evaluation of a company's future performance, so try the calculation yourself and check your own assumptions. The DCF also does not consider the possible cyclicality of an industry, or a company's future capital requirements, so it does not give a full picture of a company's potential performance. Given that we are looking at Kinder Morgan as potential shareholders, the cost of equity is used as the discount rate, rather than the cost of capital (or weighted average cost of capital, WACC) which accounts for debt. In this calculation we've used 9.5%, which is based on a levered beta of 1.549. Beta is a measure of a stock's volatility, compared to the market as a whole. We get our beta from the industry average beta of globally comparable companies, with an imposed limit between 0.8 and 2.0, which is a reasonable range for a stable business.
SWOT Analysis for Kinder Morgan
- Dividend is in the top 25% of dividend payers in the market.
- Dividend information for KMI.
- Earnings declined over the past year.
- Interest payments on debt are not well covered.
- Expensive based on P/E ratio and estimated fair value.
- Annual earnings are forecast to grow for the next 3 years.
- Debt is not well covered by operating cash flow.
- Dividends are not covered by earnings and cashflows.
- Annual earnings are forecast to grow slower than the American market.
- Is KMI well equipped to handle threats?
Next Steps:
Valuation is only one side of the coin in terms of building your investment thesis, and it is only one of many factors that you need to assess for a company. The DCF model is not a perfect stock valuation tool. Rather it should be seen as a guide to "what assumptions need to be true for this stock to be under/overvalued?" If a company grows at a different rate, or if its cost of equity or risk free rate changes sharply, the output can look very different. For Kinder Morgan, we've compiled three relevant aspects you should consider:
- Risks: Take risks, for example - Kinder Morgan has 3 warning signs (and 2 which make us uncomfortable) we think you should know about.
- Management:Have insiders been ramping up their shares to take advantage of the market's sentiment for KMI's future outlook? Check out our management and board analysis with insights on CEO compensation and governance factors.
- Other High Quality Alternatives: Do you like a good all-rounder? Explore our interactive list of high quality stocks to get an idea of what else is out there you may be missing!
PS. The Simply Wall St app conducts a discounted cash flow valuation for every stock on the NYSE every day. If you want to find the calculation for other stocks just search here.
Have feedback on this article? Concerned about the content? Get in touch with us directly. Alternatively, email editorial-team (at) simplywallst.com.
This article by Simply Wall St is general in nature. We provide commentary based on historical data and analyst forecasts only using an unbiased methodology and our articles are not intended to be financial advice. It does not constitute a recommendation to buy or sell any stock, and does not take account of your objectives, or your financial situation. We aim to bring you long-term focused analysis driven by fundamental data. Note that our analysis may not factor in the latest price-sensitive company announcements or qualitative material. Simply Wall St has no position in any stocks mentioned.