
Gartner's (NYSE:IT) 24% CAGR Outpaced the Company's Earnings Growth Over the Same Five-year Period
Gartner's (NYSE:IT) 24% CAGR Outpaced the Company's Earnings Growth Over the Same Five-year Period
When you buy a stock there is always a possibility that it could drop 100%. But on a lighter note, a good company can see its share price rise well over 100%. One great example is Gartner, Inc. (NYSE:IT) which saw its share price drive 196% higher over five years. And in the last week the share price has popped 3.7%. But this could be related to the buoyant market which is up about 1.7% in a week.
購買股票時總有可能下跌100%。但是在較輕的筆記中,一個好公司的股價可以上漲超過100%。一個很好的例子是Gartner,Inc.(紐交所:IT),其股價在五年內增長196%。上週,股價上漲了3.7%。但這可能與繁榮的市場有關,市場一週上漲約1.7%。
Since it's been a strong week for Gartner shareholders, let's have a look at trend of the longer term fundamentals.
由於Gartner的股東表現強勁,讓我們來看看更長期基本面的趨勢。
While markets are a powerful pricing mechanism, share prices reflect investor sentiment, not just underlying business performance. One flawed but reasonable way to assess how sentiment around a company has changed is to compare the earnings per share (EPS) with the share price.
雖然市場是一個強大的定價機制,但股價反映了投資者情緒,不僅僅是基本業績。一種有缺陷但合理的評估公司周圍情緒如何變化的方法是將每股收益(EPS)與股價進行比較。
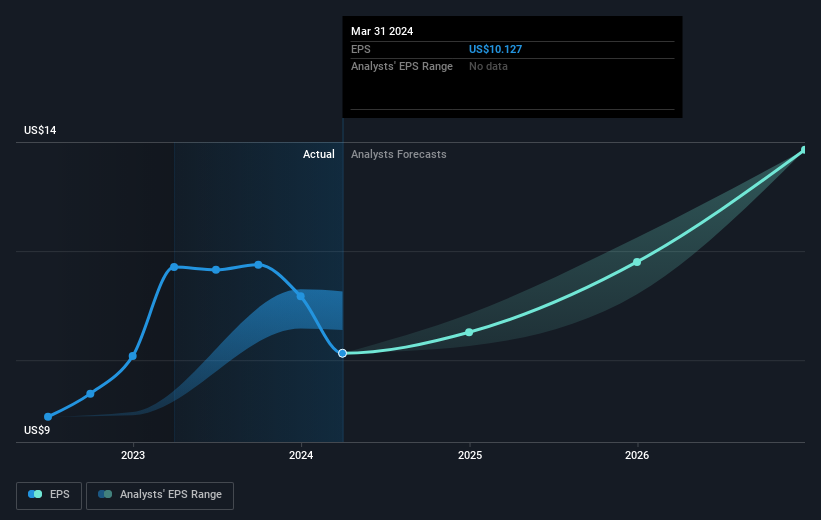
Over half a decade, Gartner managed to grow its earnings per share at 42% a year. This EPS growth is higher than the 24% average annual increase in the share price. So one could conclude that the broader market has become more cautious towards the stock.
在過去半個世紀中,Gartner成功地將每股收益增長42%。這種EPS增長高於股價每年平均增長24%。因此,可以得出結論,股市整體更加謹慎地看待這隻股票。
The graphic below depicts how EPS has changed over time (unveil the exact values by clicking on the image).
下圖顯示了EPS隨時間變化的情況(點擊圖像以顯示確切值)。
It is of course excellent to see how Gartner has grown profits over the years, but the future is more important for shareholders. If you are thinking of buying or selling Gartner stock, you should check out this FREE detailed report on its balance sheet.
能看到Gartner多年來盈利增長是非常好的,但未來對股東來說更加重要。如果您正在考慮買入或賣出Gartner的股票,則應查看有關其資產負債表的免費詳細報告。
A Different Perspective
不同的觀點
It's good to see that Gartner has rewarded shareholders with a total shareholder return of 38% in the last twelve months. That gain is better than the annual TSR over five years, which is 24%. Therefore it seems like sentiment around the company has been positive lately. In the best case scenario, this may hint at some real business momentum, implying that now could be a great time to delve deeper. It's always interesting to track share price performance over the longer term. But to understand Gartner better, we need to consider many other factors. Consider for instance, the ever-present spectre of investment risk. We've identified 2 warning signs with Gartner , and understanding them should be part of your investment process.
很高興看到Gartner在過去十二個月中爲股東帶來了38%的總股東回報。該收益率比五年期的平均收益率24%更高。因此,似乎近期公司周圍的情感都是積極的。在最好的情況下,這可能暗示着真正的業務動力,這意味着現在深入研究可能是一個好時機。跟蹤股票的長期表現總是很有趣的。但是爲了更好地了解Gartner,我們需要考慮許多其他因素。例如,投資風險的常識。我們已經確定了Gartner的兩個預警信號,了解它們應該是您的投資過程的一部分。
If you are like me, then you will not want to miss this free list of undervalued small caps that insiders are buying.
如果您像我一樣,就不會希望錯過這份免費的內部人士正在購買的低估小市值股票列表。
Please note, the market returns quoted in this article reflect the market weighted average returns of stocks that currently trade on American exchanges.
請注意,本文所引述的市場回報反映了目前在美國交易所上市的股票的市場加權平均回報。
Have feedback on this article? Concerned about the content? Get in touch with us directly. Alternatively, email editorial-team (at) simplywallst.com.
This article by Simply Wall St is general in nature. We provide commentary based on historical data and analyst forecasts only using an unbiased methodology and our articles are not intended to be financial advice. It does not constitute a recommendation to buy or sell any stock, and does not take account of your objectives, or your financial situation. We aim to bring you long-term focused analysis driven by fundamental data. Note that our analysis may not factor in the latest price-sensitive company announcements or qualitative material. Simply Wall St has no position in any stocks mentioned.
對本文有反饋?關於內容有所顧慮?直接和我們聯繫。或者,發送電子郵件至editorial-team (at) simplywallst.com。
這篇文章是Simply Wall St的一般性文章。我們根據歷史數據和分析師預測提供評論,只使用公正的方法論,我們的文章並不意味着提供任何金融建議。文章不構成買賣任何股票的建議,也不考慮您的目標或您的財務狀況。我們的目標是帶給您基本數據驅動的長期關注分析。請注意,我們的分析可能不考慮最新的價格敏感公司公告或定性材料。Simply Wall St沒有任何股票頭寸。
譯文內容由第三人軟體翻譯。