
Darling Ingredients (NYSE:DAR) Might Have The Makings Of A Multi-Bagger
Darling Ingredients (NYSE:DAR) Might Have The Makings Of A Multi-Bagger
If we want to find a potential multi-bagger, often there are underlying trends that can provide clues. Amongst other things, we'll want to see two things; firstly, a growing return on capital employed (ROCE) and secondly, an expansion in the company's amount of capital employed. This shows us that it's a compounding machine, able to continually reinvest its earnings back into the business and generate higher returns. So on that note, Darling Ingredients (NYSE:DAR) looks quite promising in regards to its trends of return on capital.
如果我們想找到潛在的多袋裝袋機,通常有一些潛在的趨勢可以提供線索。除其他外,我們希望看到兩件事;首先,成長 返回 論資本使用率(ROCE),其次是公司的擴張 金額 所用資本的比例。這向我們表明,它是一臺複合機器,能夠持續將其收益再投資到業務中併產生更高的回報。因此,從這個角度來看,Darling Ingredients(紐約證券交易所代碼:DAR)的資本回報率趨勢看起來相當樂觀。
What Is Return On Capital Employed (ROCE)?
什麼是資本使用回報率(ROCE)?
If you haven't worked with ROCE before, it measures the 'return' (pre-tax profit) a company generates from capital employed in its business. Analysts use this formula to calculate it for Darling Ingredients:
如果你以前沒有與ROCE合作過,它會衡量公司從其業務中使用的資本中產生的 “回報”(稅前利潤)。分析師使用這個公式來計算 Darling Ingredients 的價格:
Return on Capital Employed = Earnings Before Interest and Tax (EBIT) ÷ (Total Assets - Current Liabilities)
已動用資本回報率 = 息稅前收益 (EBIT) ¥(總資產-流動負債)
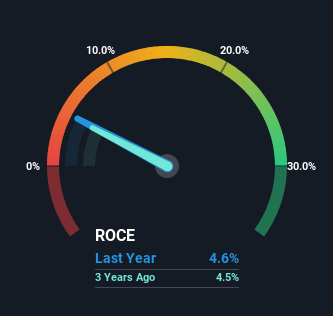
0.046 = US$463m ÷ (US$11b - US$967m) (Based on the trailing twelve months to March 2024).
0.046 = 4.63億美元 ÷(110億美元-9.67億美元) (基於截至2024年3月的過去十二個月)。
Therefore, Darling Ingredients has an ROCE of 4.6%. In absolute terms, that's a low return and it also under-performs the Food industry average of 11%.
因此,Darling Ingredients的投資回報率爲4.6%。從絕對值來看,回報率很低,也低於食品行業11%的平均水平。
In the above chart we have measured Darling Ingredients' prior ROCE against its prior performance, but the future is arguably more important. If you'd like to see what analysts are forecasting going forward, you should check out our free analyst report for Darling Ingredients .
在上圖中,我們將Darling Ingredients之前的投資回報率與之前的表現進行了對比,但可以說,未來更爲重要。如果你想了解分析師對未來的預測,你應該查看我們的 Darling Ingredients 免費分析師報告。
What Does the ROCE Trend For Darling Ingredients Tell Us?
Darling 原料的 ROCE 趨勢告訴我們什麼?
While in absolute terms it isn't a high ROCE, it's promising to see that it has been moving in the right direction. Over the last five years, returns on capital employed have risen substantially to 4.6%. Basically the business is earning more per dollar of capital invested and in addition to that, 124% more capital is being employed now too. So we're very much inspired by what we're seeing at Darling Ingredients thanks to its ability to profitably reinvest capital.
儘管從絕對值來看,它並不是一個很高的投資回報率,但它有望看到它一直在朝着正確的方向前進。在過去五年中,已動用資本回報率大幅上升至4.6%。基本上,企業每投資1美元的資本就能獲得更多的收入,除此之外,現在使用的資本也增加了124%。因此,我們在Darling Ingredients所看到的情況給我們帶來了極大的啓發,這要歸功於它能夠盈利地進行資本再投資。
The Key Takeaway
關鍵要點
To sum it up, Darling Ingredients has proven it can reinvest in the business and generate higher returns on that capital employed, which is terrific. And with the stock having performed exceptionally well over the last five years, these patterns are being accounted for by investors. Therefore, we think it would be worth your time to check if these trends are going to continue.
總而言之,Darling Ingredients已經證明它可以對業務進行再投資,並從所使用的資本中獲得更高的回報,這太棒了。而且,由於該股在過去五年中表現異常出色,投資者正在考慮這些模式。因此,我們認爲值得您花時間檢查這些趨勢是否會持續下去。
On a separate note, we've found 1 warning sign for Darling Ingredients you'll probably want to know about.
另一方面,我們發現了你可能想知道的 Darling Ingredients 的 1 個警告信號。
While Darling Ingredients isn't earning the highest return, check out this free list of companies that are earning high returns on equity with solid balance sheets.
儘管Darling Ingredients的回報率並不高,但請查看這份免費的股票回報率高、資產負債表穩健的公司名單。
Have feedback on this article? Concerned about the content? Get in touch with us directly. Alternatively, email editorial-team (at) simplywallst.com.
This article by Simply Wall St is general in nature. We provide commentary based on historical data and analyst forecasts only using an unbiased methodology and our articles are not intended to be financial advice. It does not constitute a recommendation to buy or sell any stock, and does not take account of your objectives, or your financial situation. We aim to bring you long-term focused analysis driven by fundamental data. Note that our analysis may not factor in the latest price-sensitive company announcements or qualitative material. Simply Wall St has no position in any stocks mentioned.
對這篇文章有反饋嗎?對內容感到擔憂?直接聯繫我們。 或者,給編輯團隊 (at) simplywallst.com 發送電子郵件。
Simply Wall St的這篇文章本質上是籠統的。我們僅使用公正的方法根據歷史數據和分析師的預測提供評論,我們的文章無意作爲財務建議。它不構成買入或賣出任何股票的建議,也沒有考慮到您的目標或財務狀況。我們的目標是爲您提供由基本數據驅動的長期重點分析。請注意,我們的分析可能不考慮最新的價格敏感型公司公告或定性材料。簡而言之,華爾街沒有持有任何上述股票的頭寸。
譯文內容由第三人軟體翻譯。